Composer

Composer
OpenDataDSL launches Composer: analytic worksheets of curves and timeseries, built in minutes and kept up to date automaticallyLine up curves and timeseries side by side, calculate spreads and margins, and chart them. No code, no spreadsheet copies, rebuilt every time the data changes.
OpenDataDSL today announces Composer, a new extension that lets energy and commodity teams build the analytic views they use every day, such as spreads, margins, converted curves and rolling histories, directly on their OpenDataDSL data.
The problem Composer solves
Much of the analysis a trading, risk or analytics team does each day means putting prices side by side and working something out: the NBP premium over TTF, the clean spark spread, a curve in another currency, the front month as a daily history. That work usually happens in spreadsheets, with data copied in, formulas that break when tenors roll, and charts only one person knows how to refresh.
How it works
A composition is a worksheet of curves or timeseries, lined up by tenor or by date. Each column is one of:
- Data: a forward curve, a timeseries, or one tenor of a curve as a daily history.
- Expression: a spread, ratio, margin or formula using the other columns, for example
POWER - GAS / 0.55 - 0.37 * CO2. - Linked: a column of another composition, so views can build on each other.
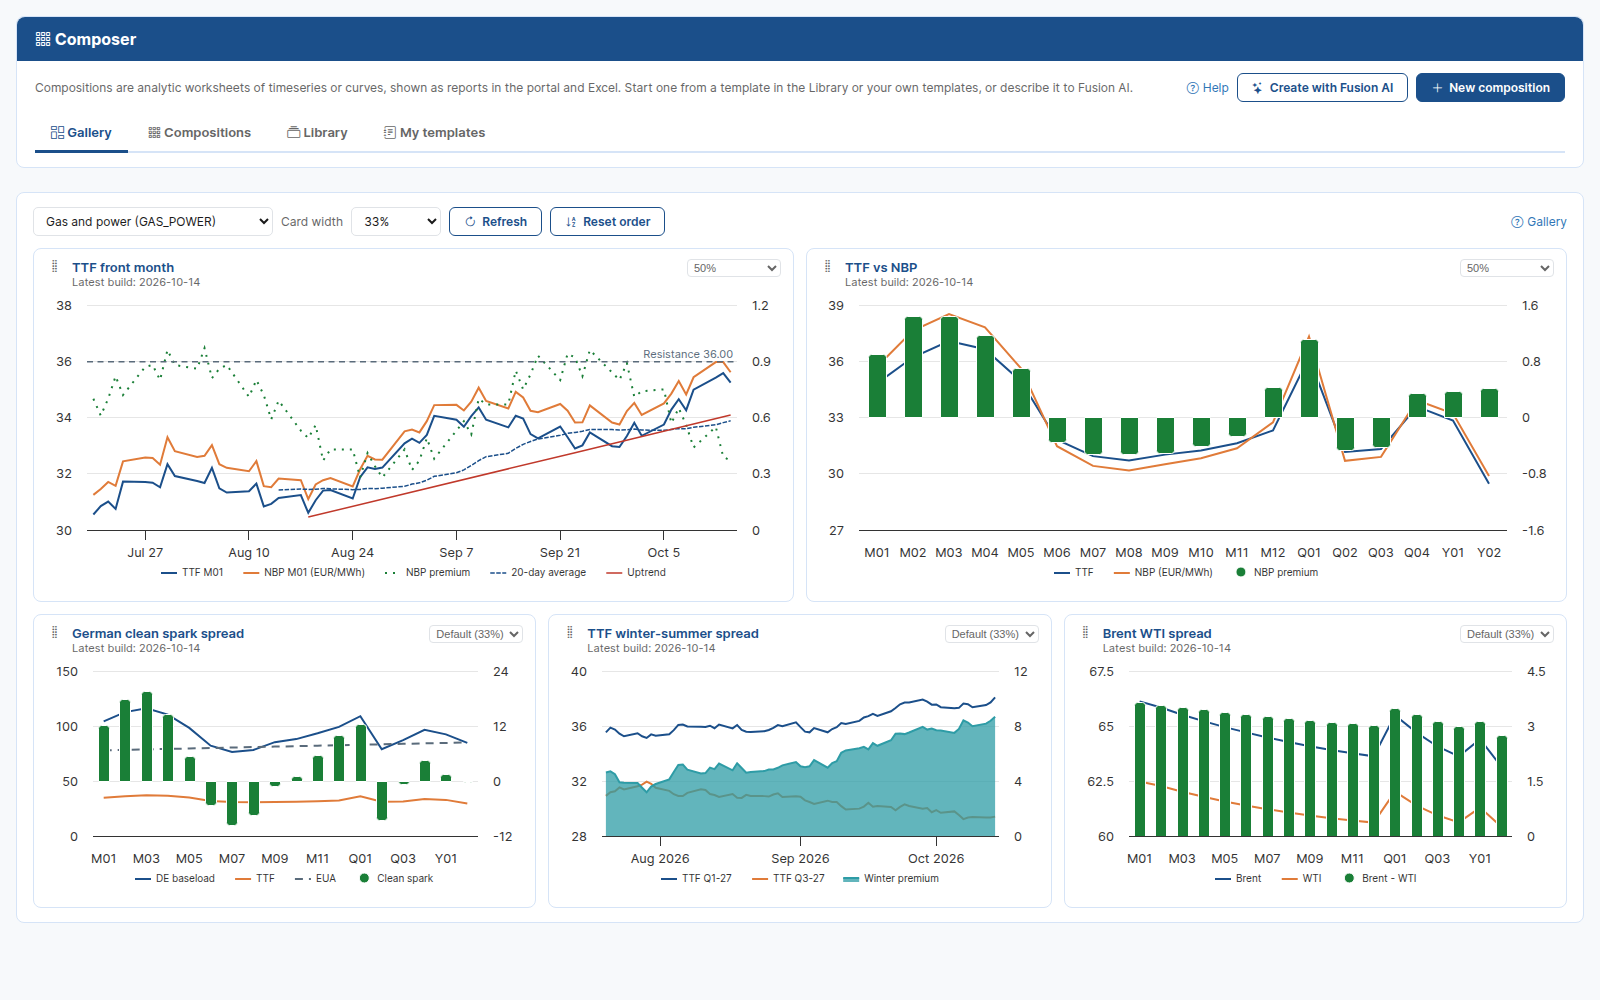
Composer converts currencies, units and calendars column by column, and shows the result as a table and a chart beside the settings, so every change can be checked straight away.
Built for everyday use
- 50 library templates: curve and timeseries spreads, clean spark and dark spreads, crack spreads, gas hub basis, oil-indexed gas, LNG export margins, tolling and PPA values, FX cross rates, metals and agriculture spreads, hedge mark to market and more. Teams can save their own templates too.
- Fusion AI: describe a composition in a sentence and Fusion designs it, or ask Fusion to change an existing one and review the difference before applying it.
- Builds and automation: each day's result is stored, and a composition is rebuilt automatically when the curves and timeseries it reads are updated.
- Composed curves and timeseries: any column can be published as a curve or timeseries that the rest of the platform uses like any other.
- Chart indicators: trend lines, levels, moving averages and Bollinger bands, drawn on the chart. An indicator added today is carried onto future builds.
- Gallery: each analytics area as a board of live charts, arranged and sized by each user.
- Everywhere: every composition is a report in the portal and in the Excel Add-in, where it opens as a table of tenors or dates with just the columns you mark for Excel.
Availability
Composer is available now as an extension for OpenDataDSL customers. Find out more on the Composer page, or read the Composer documentation.

How about a demo?
Our team is here to find the right solution for you, contact us to see this in action.
Fill out your details below and somebody will be in contact with you very shortly.