Matrices in ODSL


Do you know how COVID-19 affected your industry?
In this blog, we show you how to use OpenDataDSL matrices and Excel to analyse 17 Industry Portfolios for 2 time-frames: pre COVID-19 and during COVID-19.
Analysis of 17 Industry Portfolios
Inputs
We consider United States related input data of market value weighted equity portfolios representing 17 industry sectors listed below and whose monthly return data can be found in the online database of Kenneth R. French's website. For further analysis we store the monthly returns available for the time horizon July 1926 until December 2022 as time series in ODSL using the Excel-Addin or a loader.
The list of the 17 Industries:
- FOOD: Food
- MINES: Mining and Minerals
- OIL: Oil and Petroleum Products
- CLTHS: Textiles, Apparel & Footwear
- DURBL: Consumer Durables
- CHEMS: Chemicals
- CNSM: Drugs, Soap, Perfumes, Tobacco
- CNSTR: Construction and Construction Materials
- STEEL: Steel Works Etc
- FABPR: Fabricated Products
- MACHN: Machinery and Business Equipment
- CARS: Automobiles
- TRANS: Transportation
- UTILS: Utilities
- RTAIL: Retail Stores
- FINAN: Banks, Insurance Companies, and Other Financials
- OTHER: Other
On the website of Kenneth R. French you get further information on the industry portfolio composition.
Time frames
The analysis is done for two different time horizons, specifically for the 3 years of COVID-19, namely 2020, 2021, 2022 and the 3 years before COVID-19, 2017, 2018 and 2019. Consequently for both time frames we have a set of 36 monthly observations.
Data visualisation
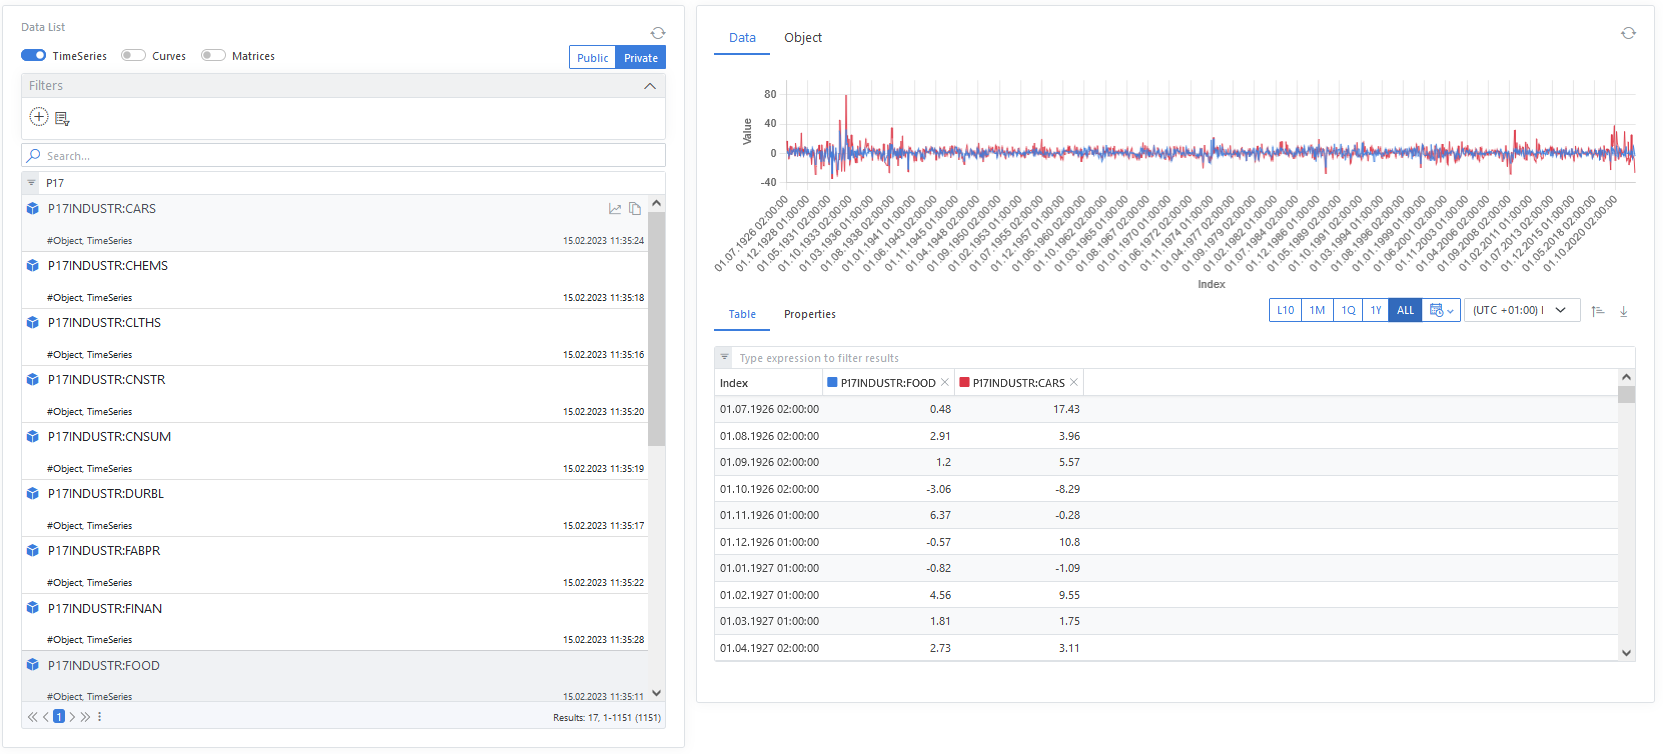
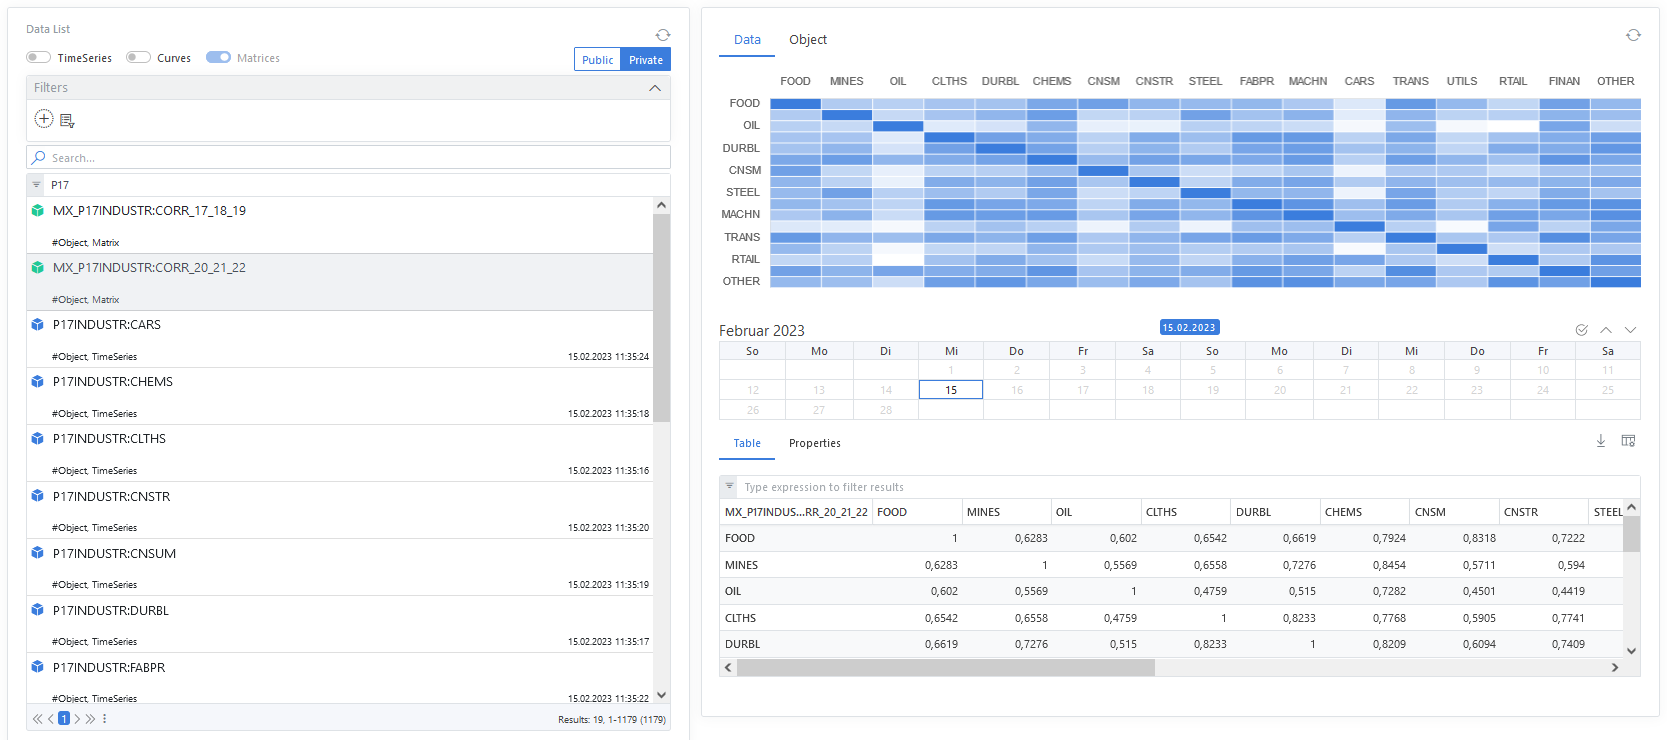
In the ODSL WebPortal the data can be checked. The below chart shows the return time series for the FOOD and CARS industries for the entire time horizon.
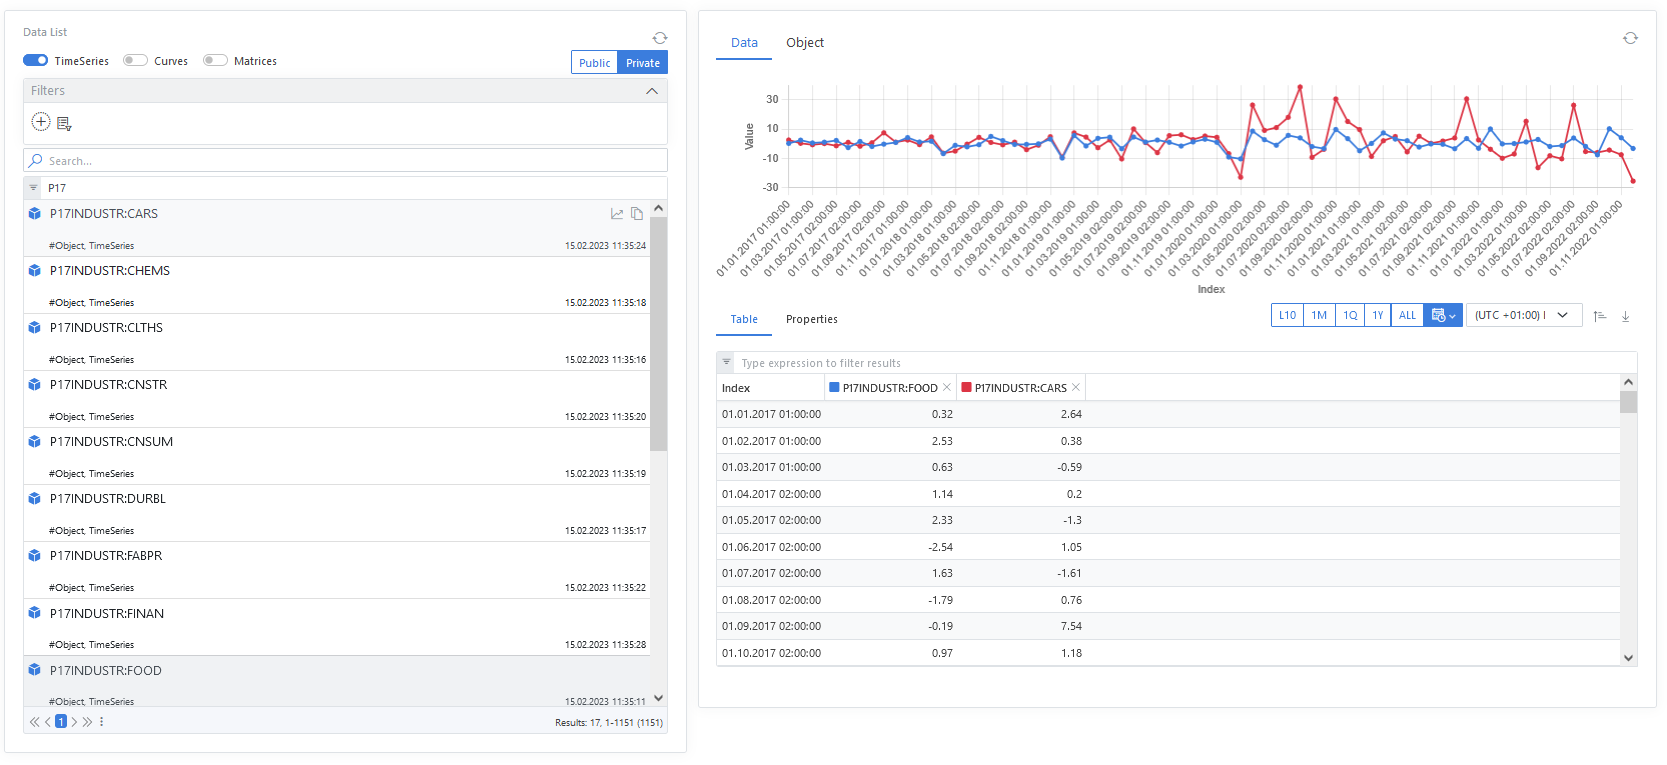
In comparison to that, we can set a specific range to show up in the WebPortal, here years 2017-2022, which cover both time frames. Looking at the two lines (blue is FOOD and red is CARS), we already see a different behaviour of the two lines: In the first half the values are quite close and in the second half the values differ quite a lot.
Usage of matrices in ODSL WebPortal
We are going to create 2 matrices to help us analyse the data:
- A matrix with the main statistics (min, max, mean, stddev)
- A correlation matrix which can help to analyse the data and represent the dependencies for the 17 industries in a structured way.
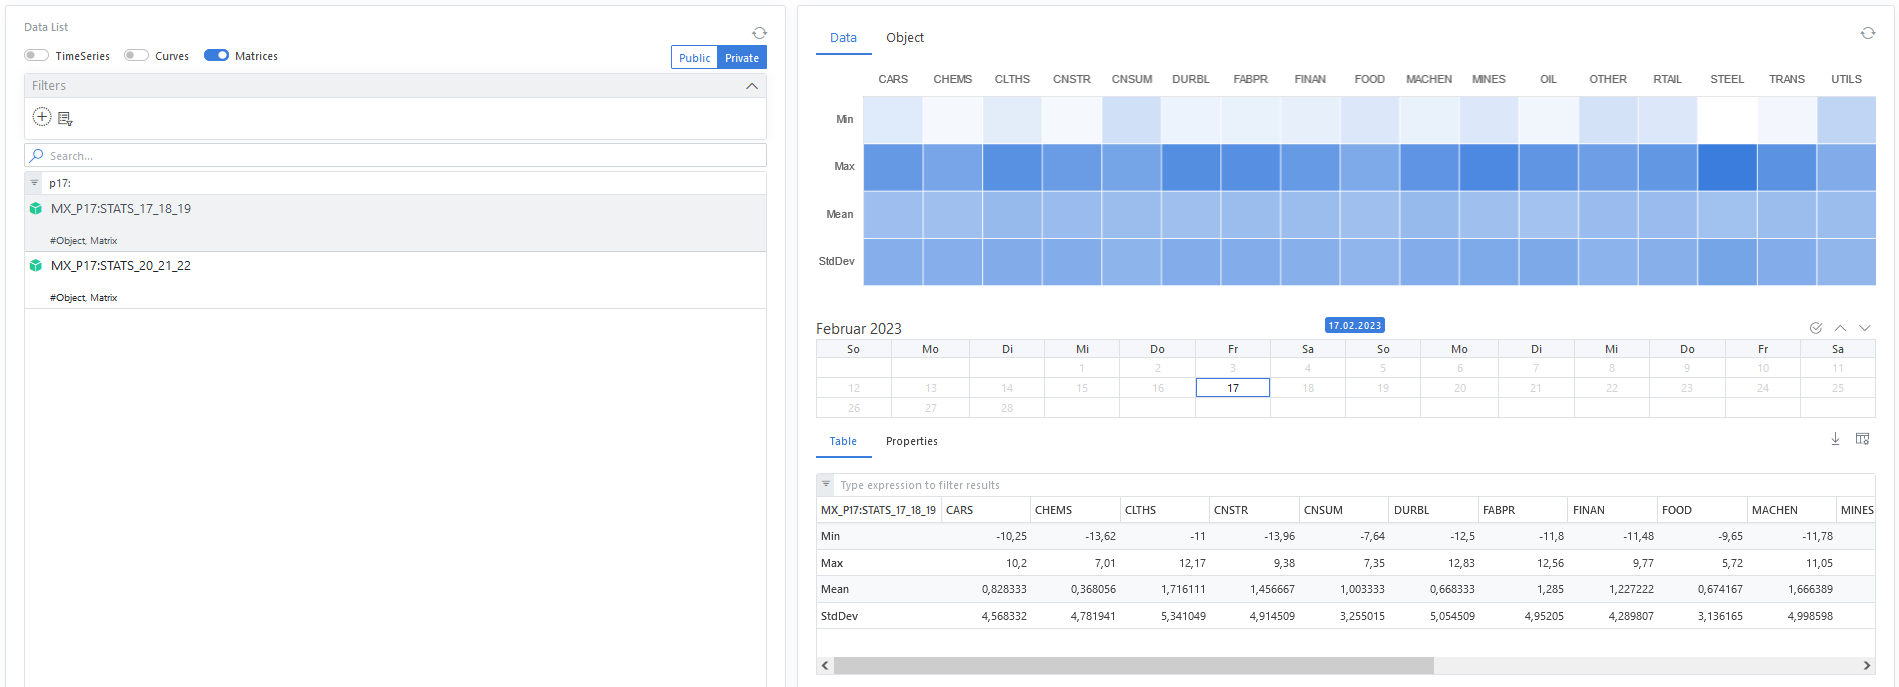
Main Statistics
As main statistics we consider minimum value, maximum value, mean and standard deviation that are calculated, stored and shown up for the two time frames.
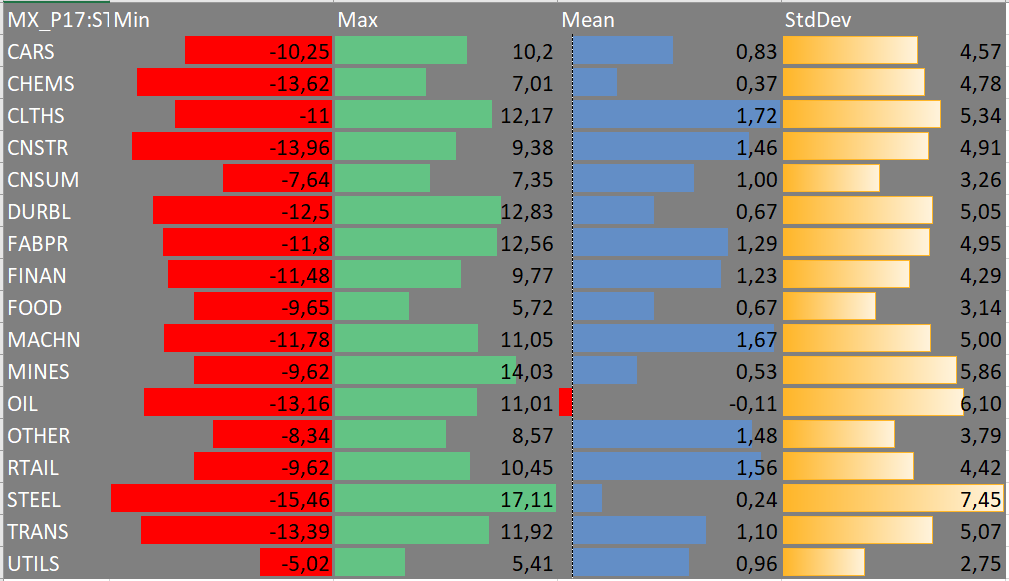
Pre COVID-19
In the time frame before COVID-19 we have the lowest return for STEEL (-15.46%) followed by CNSTR (-13.96%) and CHEMS (-13.62%) and the highest for STEEL (17.11%) followed by MINES (14.03%) and DURBL (12.83%).
For STEEL the highest risk (standard deviation 7.45%) followed by OIL (standard deviation 6.10%) is not accompanied by high returns but quite the opposite, they have the lowest returns (mean 0.24% for STEEL and -0.11% for OIL).
In an ExcelSheet, where the matrix can also be downloaded and formatted, the information looks like:
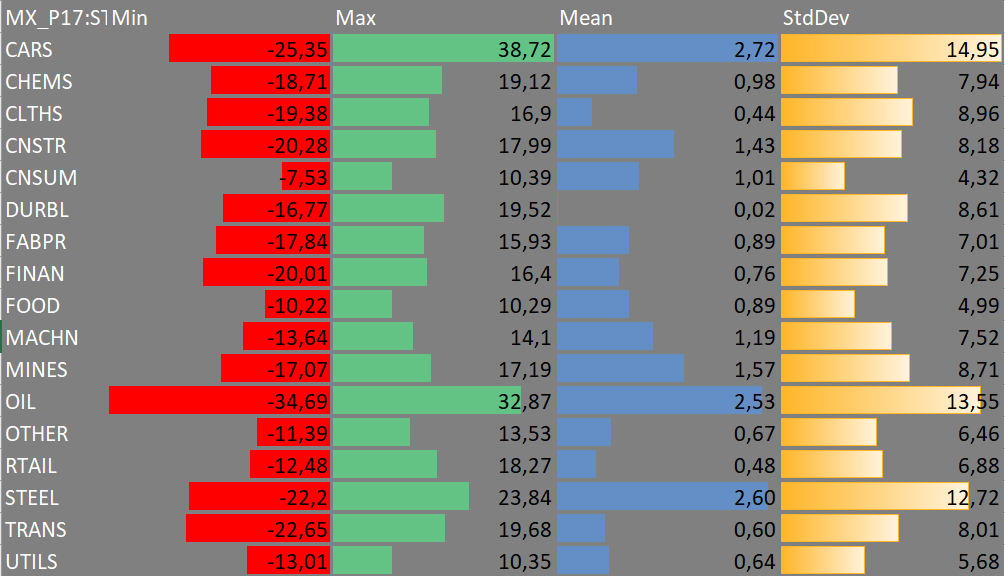
During COVID-19
During the COVID-19 period the lowest returns are noted for OIL (-34.69%) followed by CARS (-25.35%) and TRANS (-22.65%) and the highest returns for CARS (38.72%) followed by OIL (32.87%) and STEEL (23.84%).
The highest risk for CARS (standard deviation 14.95%) is here accompanied by highest return (mean 2.72%).
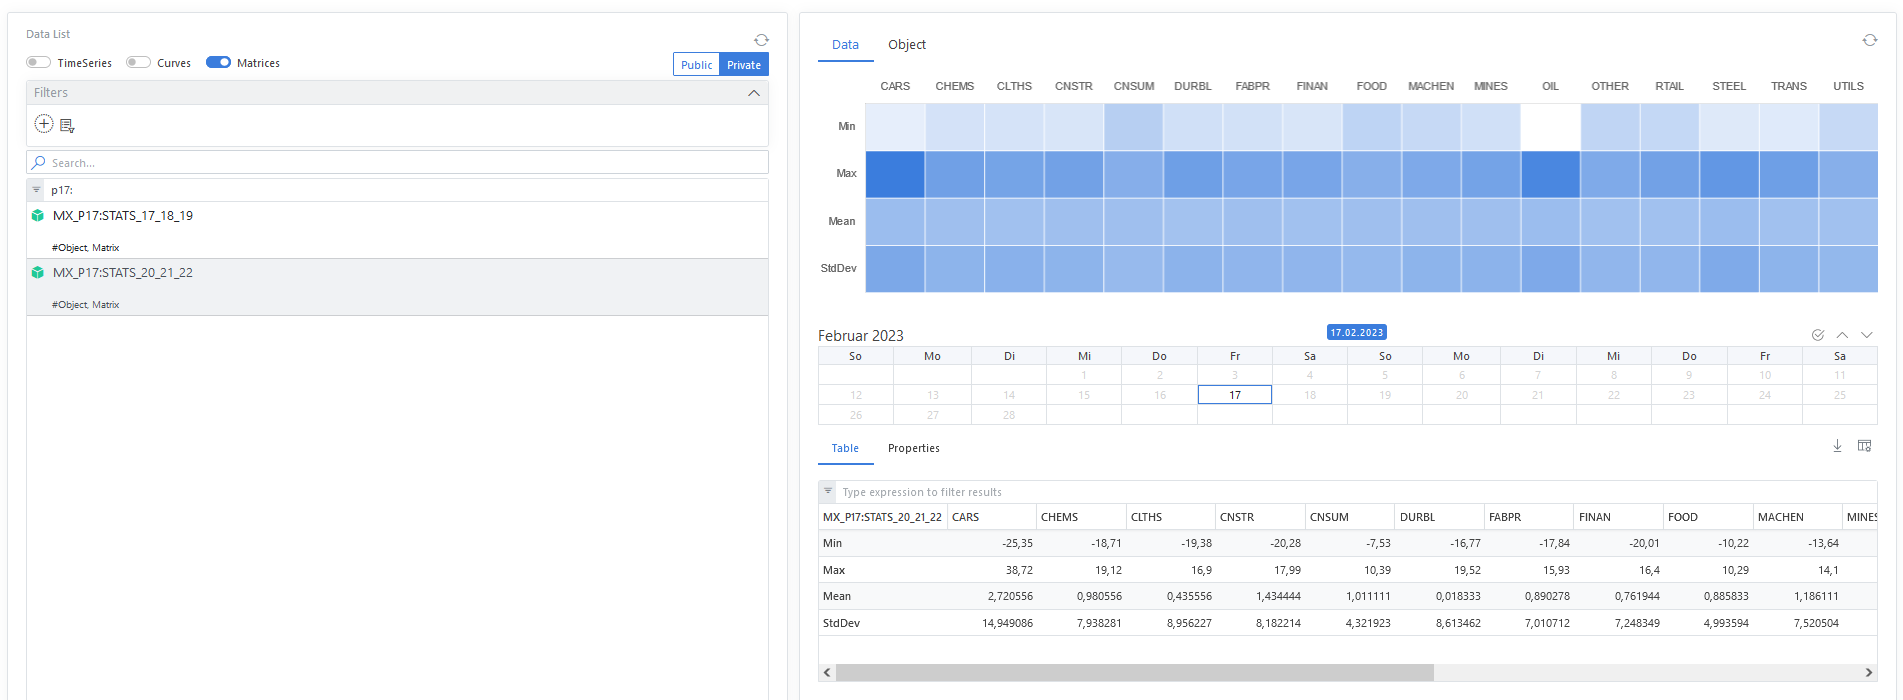
Here, the formatted matrix in Excel shows up as:
ODSL Code
// List of data sets with object_id P17INDUSTR
objects = find ${data} where _objid="P17INDUSTR"

// List of strings containing the profiles (17 industries)
d = find unique _dataid from ${data} where _objid="P17INDUSTR"

// Defining a matrix with 4 columns for statistics and 17 rows for industries
xLabels = (["Min", "Max", "Mean", "StdDev"])
stats = Matrix(d.size, xLabels.size)
stats.setXLabels(xLabels)
stats.setYLabels(d)

set precision 2
data = []
// Re-scaling the data, so pick only a specific time range for analysis
// fill the matrix
for i in objects
    i.withRange("2017-01-01", "2019-12-01")
    stats.setValueAt(i.dataid, "Min", min(i))
    stats.setValueAt(i.dataid, "Max", max(i))
    stats.setValueAt(i.dataid, "Mean", mean(i))
    stats.setValueAt(i.dataid, "StdDev", stdev(i))
next

// Define the matrix and save it
MX_P17 = Object()
MX_P17.category = "MATRIX"
MX_P17.STATS_17_18_19 = stats
save ${object: MX_P17}
Correlations between industries
The dependencies between the 17 industries can be calculated in a correlation matrix and visualized in a heatmap, where the darkest color represent highest correlation and brightest color the lowest correlation.
Pre COVID-19:
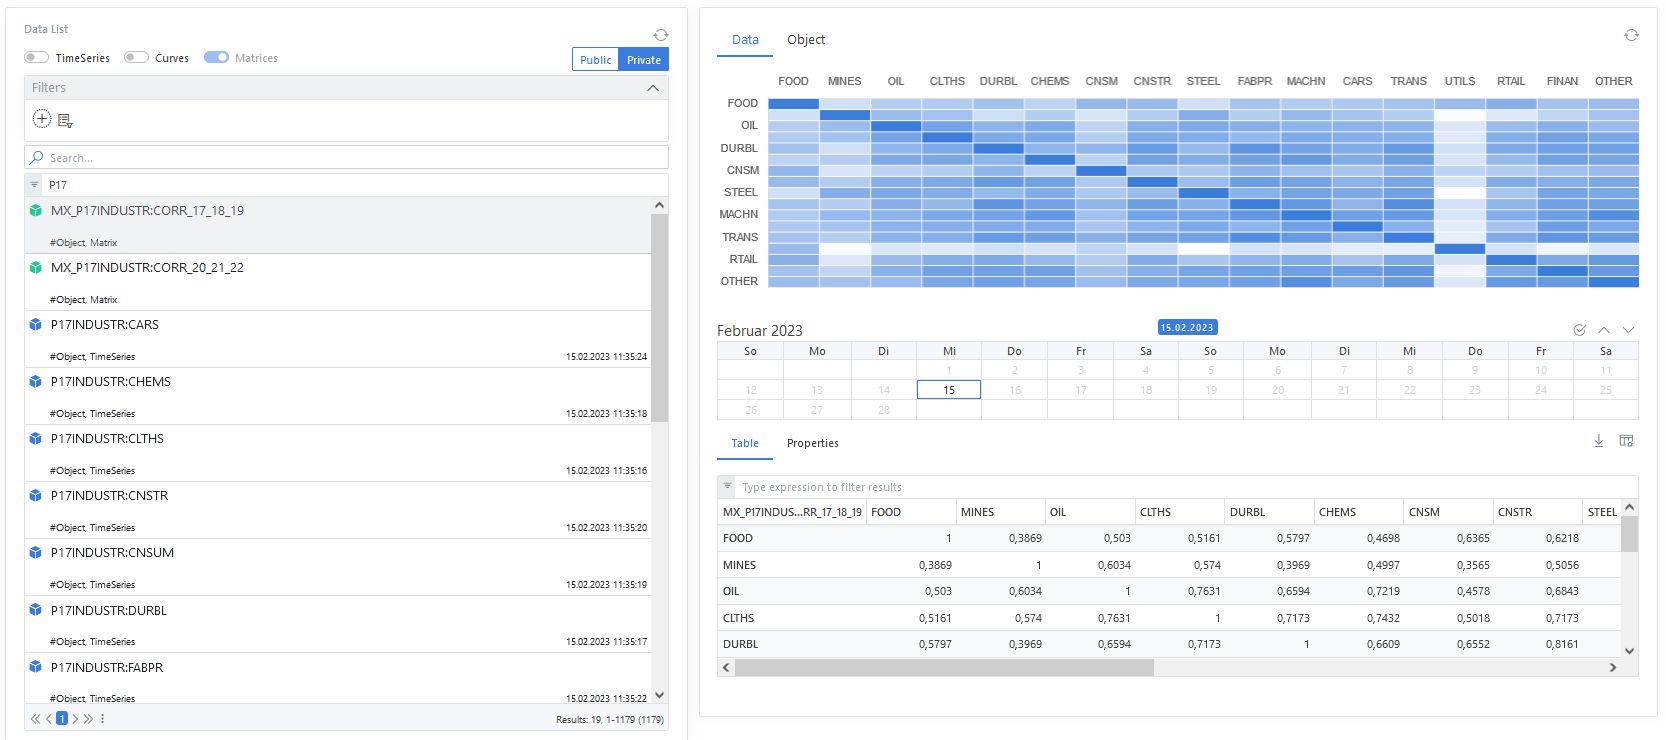
After downloading and formatting the matrix in Excel, the heatmap looks like:
The lowest correlation we notice between UTILS and the other industries.
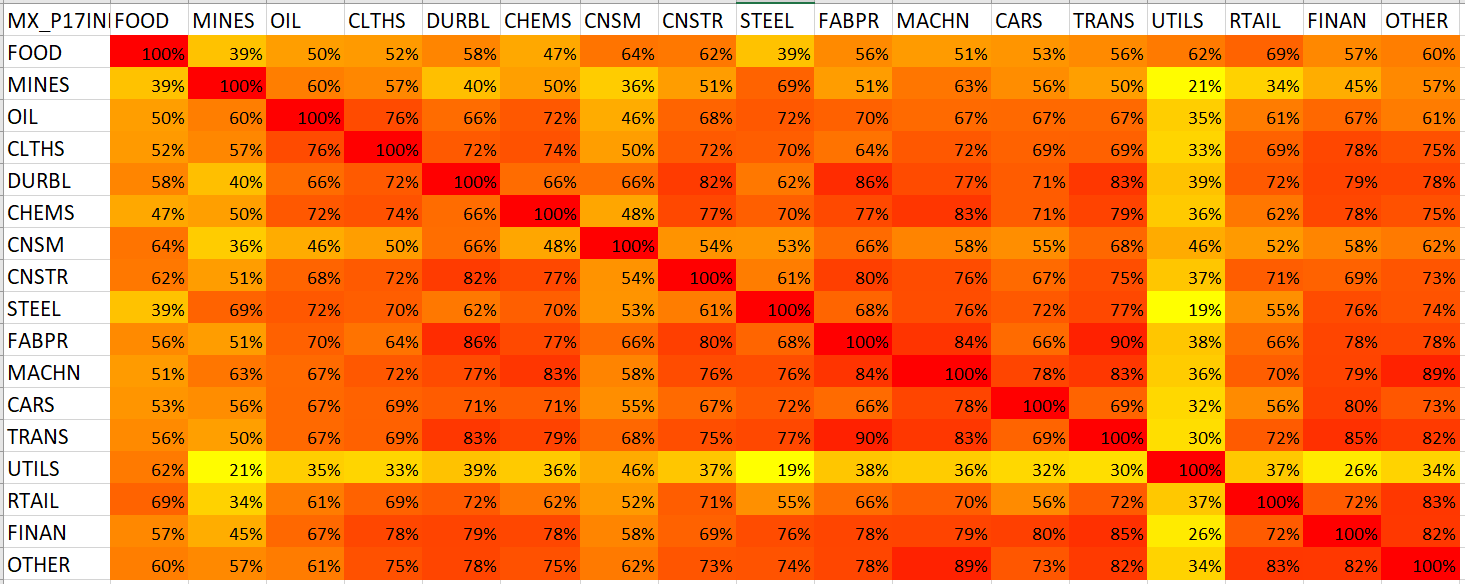
During COVID-19:
The heatmap in Excel for the time frame during COVID-19 looks like:
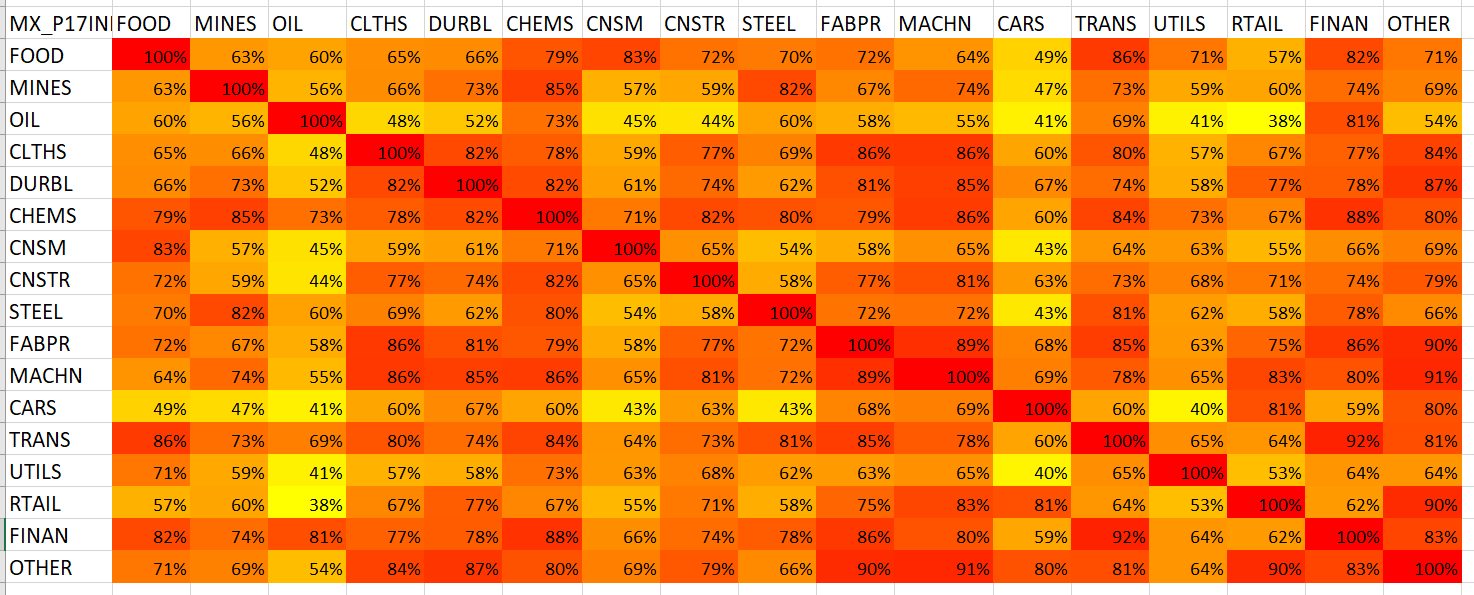
For the time during COVID-19, the heatmap looks very different. In general the correlations are lower between all industries. OIL and CARS show lowest correlations to the other industries. The demand for oil was low and we all remember in April 2020, for the first time in history, the futures price for crude oil turned negative.
But low correlations are not bad as such: Combining them in an investment portfolio holds diversification potential.
ODSL Code
// Calculate the correlation
// The output is a correlation matrix
mx = correlation(data)
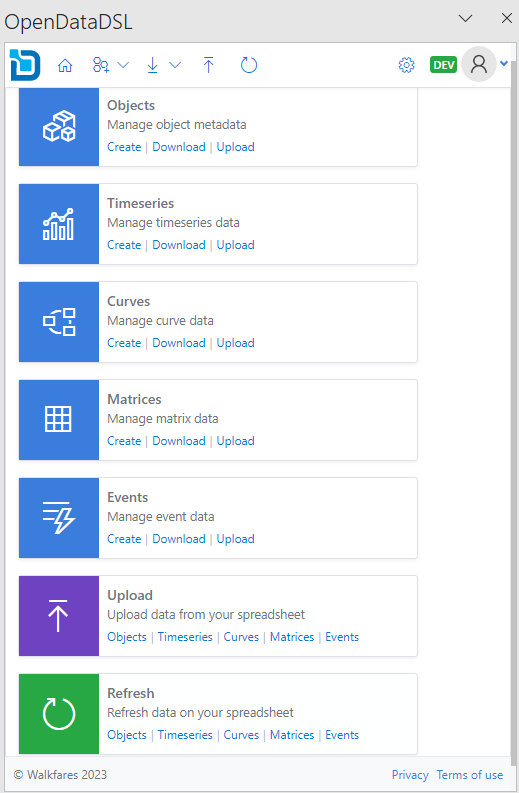
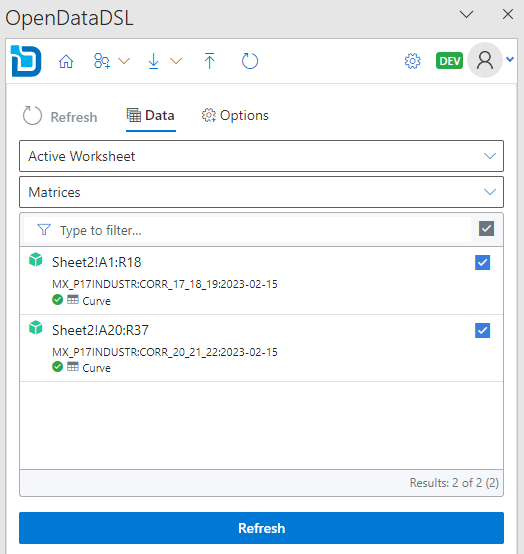
Usage of matrices in ODSL Excel-Addin
The ODSL Excel Addin provides powerful features to download, upload or refresh your data.
The Excel-Addin understands where the matrix is placed in the sheet and by (un-)ticking the box you can decide (not) to refresh the matrix data information.
Conclusion
We have shown you how to use OpenDataDSL matrices and Excel with the ODSL Excel-Addin to analyse 17 Industry Portfolios for 2 time-frames: pre COVID-19 in comparison to during COVID-19. A heatmap visualizes at a glance the dependencies between the industries and shows potential diversification potential for portfolio investment decisions.
Data analysis is the way to get insights into your data. OpenDataDSL helps you with tools you need to manage and analyse your data. ODSL matrices are a good way of presenting key information - for once-off or recurrent reporting purposes.
More information or free trial?
Tell us about your project, and we can let you know how we can help.
Contact us at info@opendatadsl.com