Simple Linear Regression


Using simple linear regression for hedging futures contracts
In this blog, we present simple linear regression and how it can be used for hedging in futures trading.
Simple Linear Regression
Simple linear regression is a statistical method used to model the relationship between two variables: a dependent variable (also called the response variable or outcome variable) and an independent variable (also called the predictor variable or explanatory variable).
The dependent variable can be expressed as a straight-line function (regression line) of the independent variable and can be represented by the equation:
y = β₀ + β₁x + ε

where:

    y - dependent variable
    x - independent variable
    β₀ - intercept term  (the value of y when x is zero)
    β₁ - slope coefficient (the change in y associated with a one-unit change in x)
    ε - error term (the random variation in the dependent variable that is not explained by the independent variable)
The goal of simple linear regression is to estimate the values of the intercept term (β₀) and the slope coefficient (β₁) that best fit the observed data. This is typically done using the method of ordinary least squares (OLS), which minimizes the sum of the squared differences between the observed values of the dependent variable and the predicted values.
Use case: Hedging
The simple linear regression approach can be used for hedging strategies, where the optimal hedge ratio is the slope coefficient of the regression line, which can be calculated as slope = correl(x,y) * stddev(y)/stddev(x). How efficient the hedge is can be determined by calculating the coefficient of determination, RSquare.
Data
CME futures settlement contract data for RBOB Gasoline (RB) and Heating Oil (HO) covering 1-years period 19 May 2022 - 19 May 2023, specifically looking at the June and August 2023 futures contracts.
Hedging with futures can be executed to mitigate risk. As long as the main contract that is hedged with a futures contract using the same underlying as well as maturity the hedge is called perfect. Having a different underlying is called a cross-hedge and a different maturity is called basis hedge.
For hedging purpose we use the day-to-day percentage price change (price return) of the futures contract data.
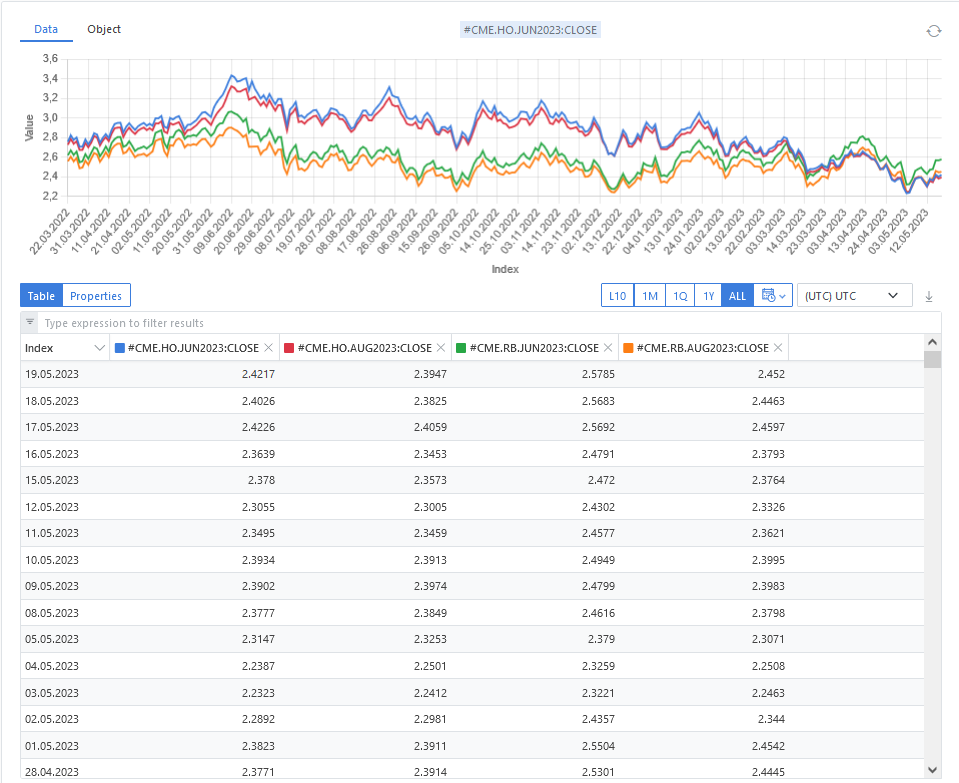
Visualisation contract data as timeseries
Visualizing the raw data of the June and August 2023 RB and HO futures contracts settlements as timeseries in the ODSL Web-Portal.
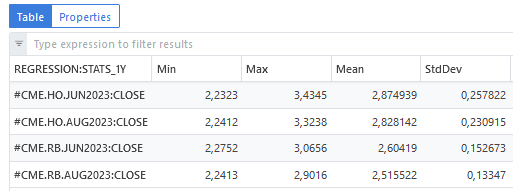
Statistics for the contracts
The main statistics for the raw price data like minimum, maximum value as well as mean and standard deviation can be calculated using ODSL functions and collecting and storing them in a matrix.
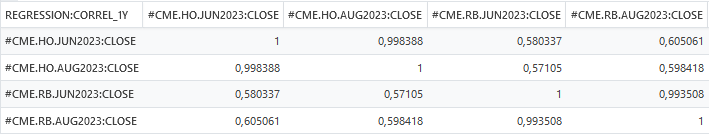
Correlation matrix for the contracts
To determine how much the contracts are related to each other, the correlation matrix is calculated. The contracts with different maturities of one future are highly correlated which is not a big surprise. The relation between the two futures RB and HO however is much lower.
Linear regression object
Check out our documentation for the linear regression object structure:
https://doc.opendatadsl.com/docs/odsl/function/simpleRegression#docusaurus_skipToContent_fallback
The output from the var = simpleRegression(TimeSeries) function is an Object with properties representing some statistical calculations on the input time-series as shown for the following example, using the day-to-day percentage price changes for x = RB June 2023 and y = RB August 2023:
// x = RB June 2023 and y = RB August 2023
{
  "sumX": 0.18072000000000002,
  "sumXX": 0.10404786621825951,
  "sumY": 0.1608210000000001,
  "sumYY": 0.09868264278256868,
  "sumXY": 0.10075939872823661,
  "n": 262,
  "xbar": 6.89770992366412E-4,
  "ybar": 6.13820610687023E-4,
  "hasIntercept": true,
  "N": 262.0,
  "R": 0.994371,
  "RSquare": 0.988774,
  "XSumSquares": 0.104048,
  "intercept": -5.4E-5,
  "interceptStdErr": 1.28E-4,
  "meanSquareError": 4.0E-6,
  "regressionSumSquares": 0.097575,
  "significance": 0.0,
  "slope": 0.968395,
  "slopeConfidenceInterval": 0.012601,
  "slopeStdErr": 0.006399,
  "sumOfCrossProducts": 0.100759,
  "sumSquaredErrors": 0.001108,
  "totalSumSquares": 0.098683
}
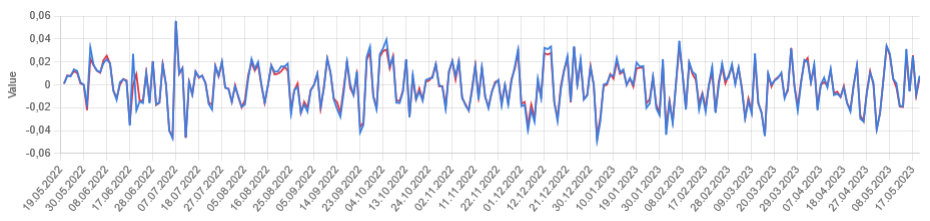
Linear regression: x = HO June 2023 and y = HO August 2023
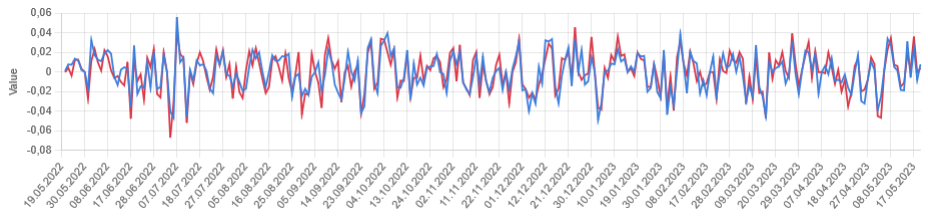
Considering the day-to-day percentage price change of the two contracts (HO is the blue line and RB is the red line), the visualization looks as follows:
The linear regression including the regression trendline looks as:
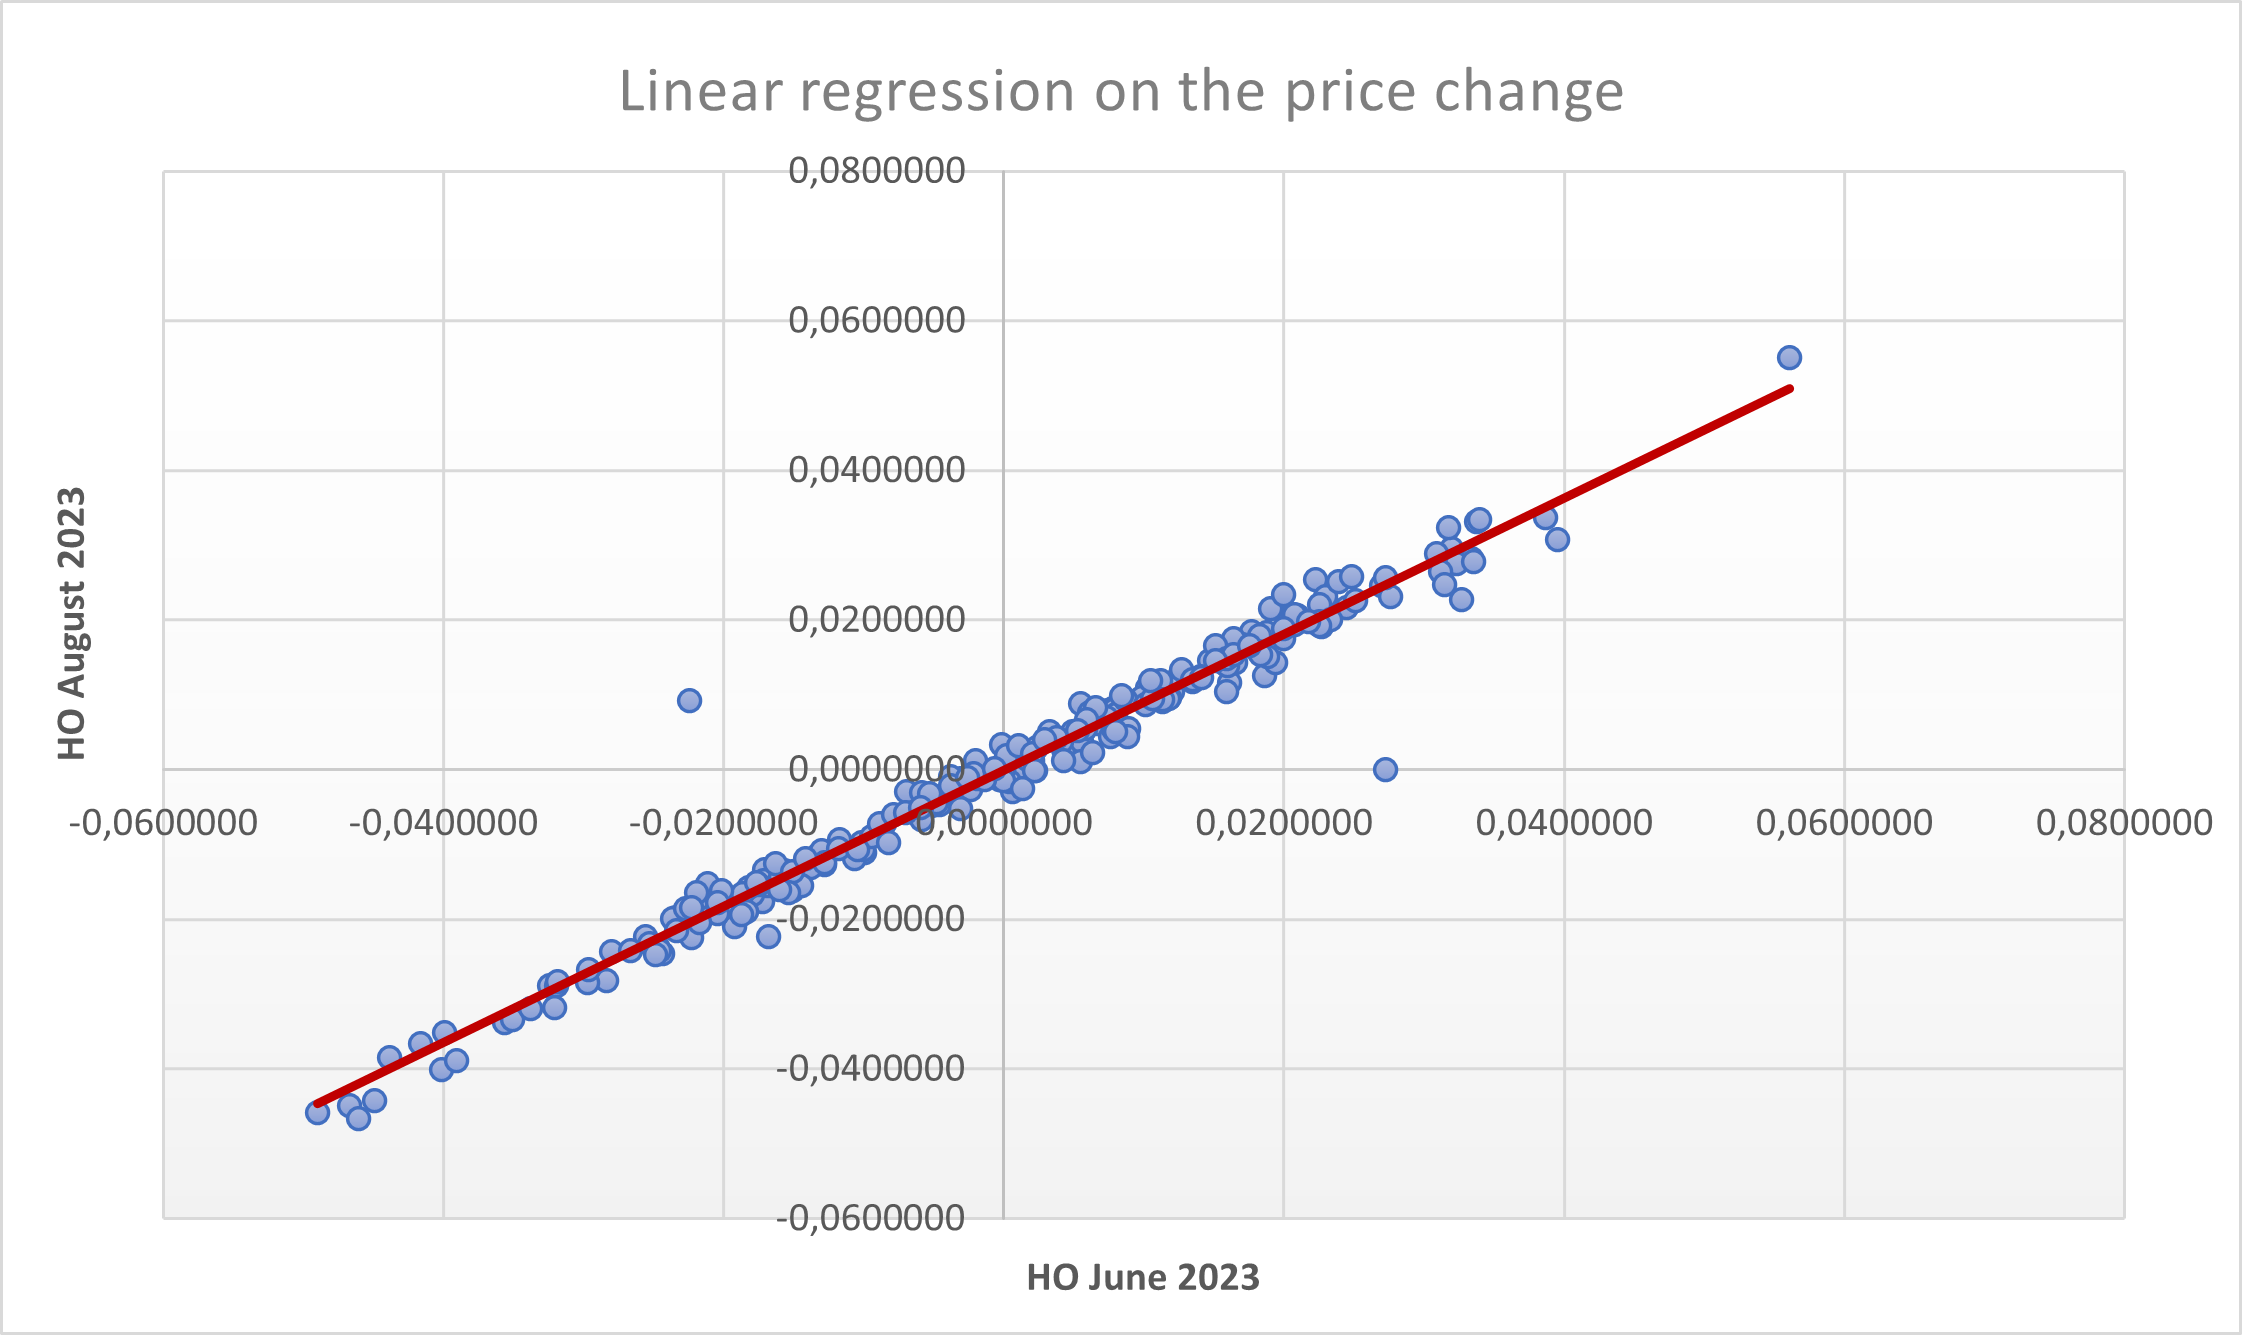
The ODSL linear regression object is calculated with the following key values that are essential for the hedge efficiency (RSquare) and the regression trendline:
// x = HO June 2023 and y = HO August 2023
{
  "R": 0.9846,
  "RSquare": 0.969437,
  "intercept": 2.9E-5,
  "slope": 0.909796,
}
The efficiency, RSquare, is 96.94% which means almost all the variability of the HO August 2023 contract is hedged by HO June 2023 contract. The high correlation and also the visualization between the settlement price data (see graphs above) already provided a first signal to it.
Linear regression: x = HO June 2023 and y = RB June 2023
Considering the day-to-day percentage price change of the two contracts (HO is the blue line and RB is the red line), the visualization looks as follows:
The linear regression including the regression trendline looks as:
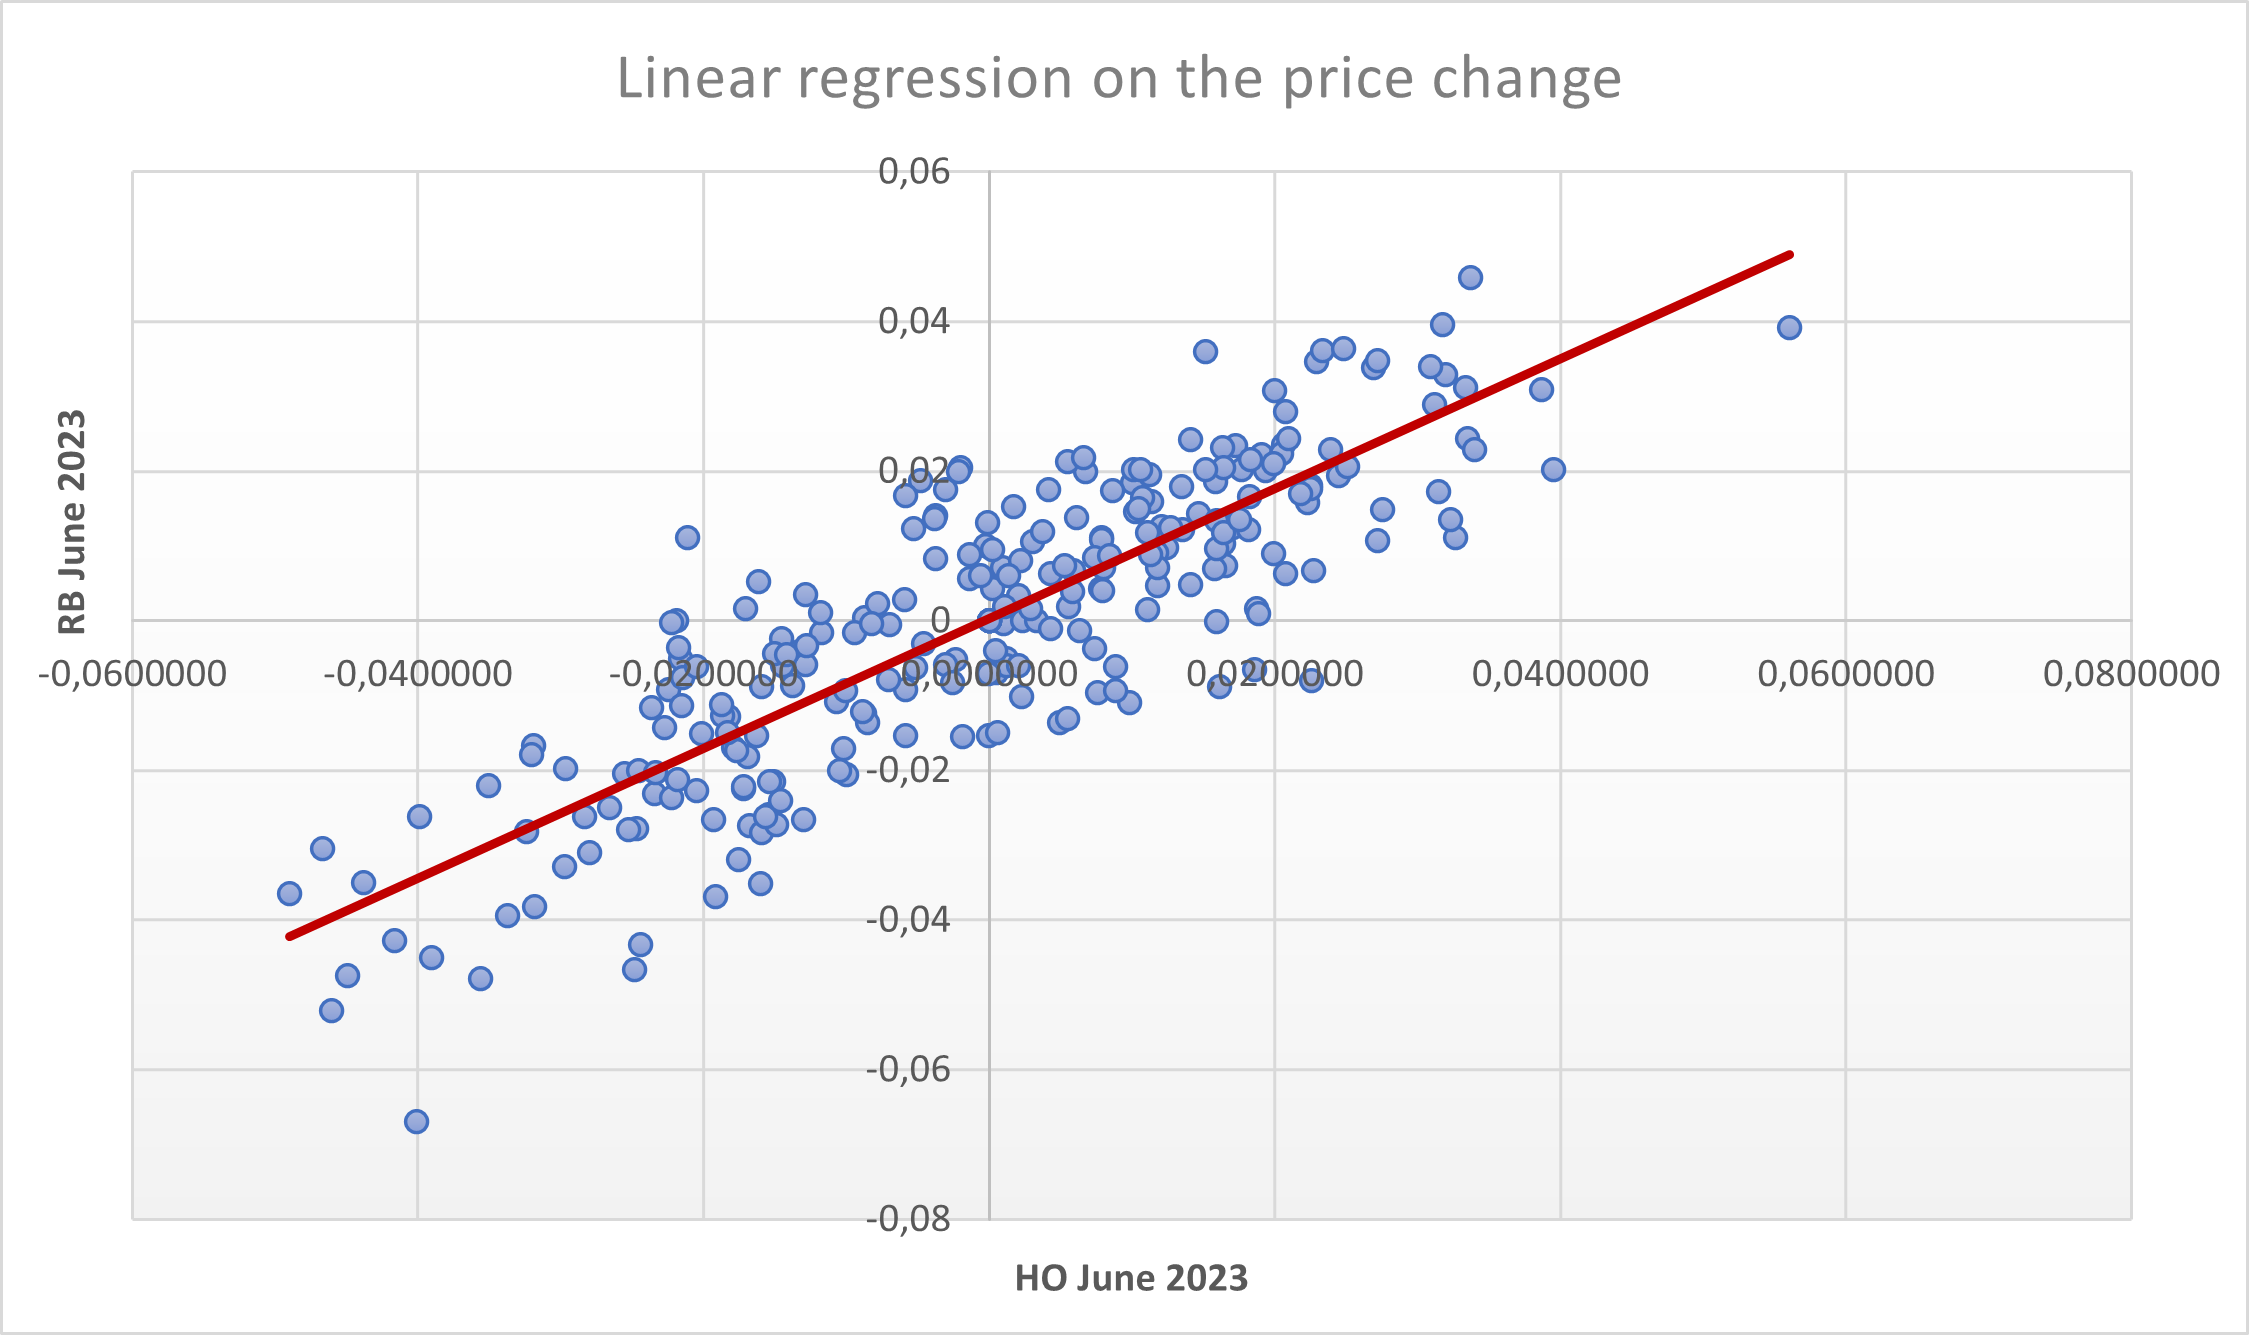
The ODSL linear regression object is calculated with the following key values that are essential for the hedge efficiency (RSquare) and the regression trendline:
//x = HO June 2023 and y = RB June 2023
{
  "R": 0.847526,
  "RSquare": 0.718301,
  "intercept": 8.73E-4,
  "slope": 0.887824,
}
The efficiency, RSquare, is 71.83% which means a big portion of the variability of the RB June 2023 contract is hedged by HO June 2023 contract. The lower correlation and also the visualization between the settlement price data (see graphs above) gave a first hint.
Conclusion
Simple linear regression is a powerful statistical method that can be used for hedging approaches. ODSL supports calculating the appropriate parameters like:
  "R"
  "RSquare"
  "intercept"
  "slope"
Next steps
Do you want to see this in action and see how you can benefit from OpenDataDSL?
Fill out the form below, we will contact you to arrange a personally tailored demo.
How about a demo?
Our team is here to find the right solution for you, contact us to see this in action.
Fill out your details below and somebody will be in contact with you very shortly.
More information or free trial?
Tell us about your project, and we can let you know how we can help.
Contact us at info@opendatadsl.com