Modelling Data Flows - Part 1


Event-driven use case
In this blog, we show you how you can model a real-world business use case using event-driven data flows in OpenDataDSL.
Part 1 - Building a forward curve and sending an email newsletter
What are event-driven data flows?
Event-driven data flows refer to a design pattern or architecture where data processing and communication happen in response to events or changes in the system. In this pattern, events trigger the flow of data through a system, where each event is processed independently, and a corresponding action is taken based on the event.
What actions can be taken?
In OpenDataDSL, as of today, you can perform one of the following event-driven actions:
- Build a forward curve
Usually when the input data for a curve is updated you would want to build a smart curve
- Send an email
Use the updated data and a template to send a HTML email to a user or users
- Run a process/workflow
Trigger a process to run possibly to load some other data
- Publish the data to another tenant
Another independent tenant can be updated with this data
- Send the data to a message queue
Send the updated data as a message to be consumed by a downstream system
- Run a report
Run a report, maybe aggregating data from other sources
- Run an ODSL script
The possibilities are endless, maybe you want to perform some derivations based on the updated data
Our business use case
Objective
The objective of this business case is to reduce or remove the time we spend on daily tasks.
Newsletter
For our use case, we are taking on the role of a market analyst who sends a daily email newsletter to his subscribers.
In the newsletter, we show:
- A forward curve which is calculated using our secret algorithm
- Some commentary about the chart
In this example, I used ChatGPT to generate some text for the newsletter
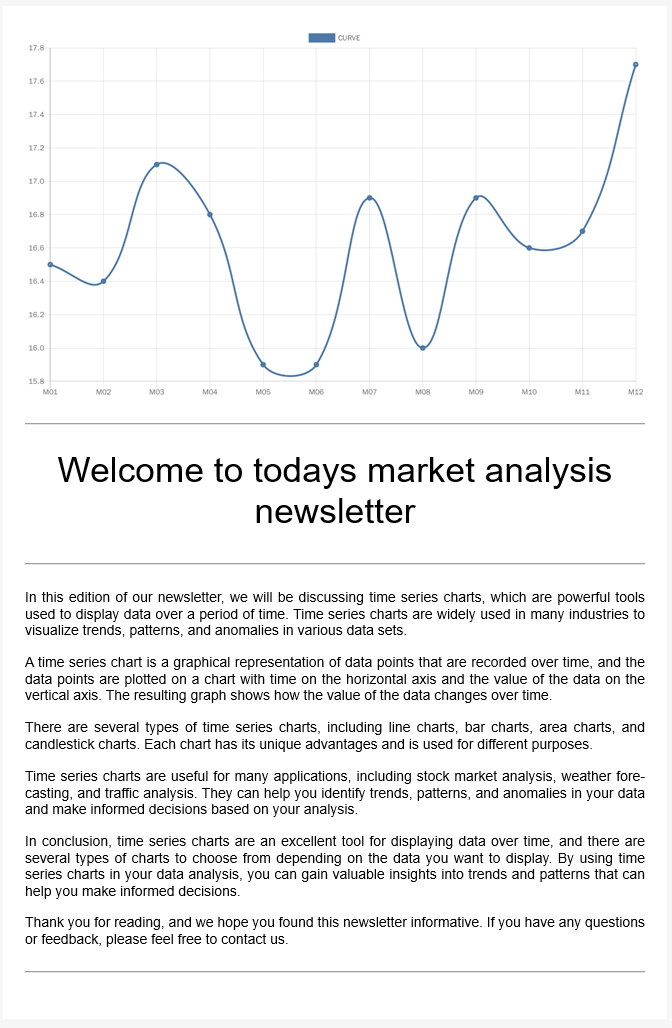
Here is what the finished newsletter looks like in the clients inbox:
Creating the use case
Our use case is broken into 2 sections:
- One-time configuration
This is the initial actions needed to create the framework and data flows
- Daily work
The work that is required to publish our newsletter on a daily basis
In order to achieve our objective, we need to perform some one-time configuration which will drastically reduce the amount of time we spend on daily tasks.
One-time configuration
The following actions are done once in order to configure the parts and flows required to produce our daily newsletter.
Create the smart curve
The newsletter will display a chart of a forward curve, here are some articles on creating SMART curves:
Once the input data for our SMART curve is updated, the SMART curve will be built automatically using the Build a forward curve action.
Create the report that will define our newsletter
The report that will generate our email is fairly simple, to create it in ODSL code:
newsletter = Report()
newsletter.template = "newsletter"
newsletter.expression = ""
save newsletter
The HTML email is created from a mustache template saved to OpenDataDSL as newsletter.mustache
Mustache is a logic-less template tool which we have incorporated into OpenDataDSL for embedding data into HTML files.
The important part of the template is as follows:
  <table role="presentation" border="0" cellpadding="0" cellspacing="0">
    <tr>
      <td>
        {{# create_chart }}"NEWSLETTER:CURVE:"+#START{{/ create_chart }}
        <hr />
        <h1>Welcome to todays market analysis newsletter</h1>
        <hr />
        {{> "newsletter-" + #START }}
        <hr />
      </td>
    </tr>
  </table>
The chart in the newsletter
In order to add the forward curve chart as a rendered image in our report, we are using QuickChart.
Quickchart is a simple, open API to render charts that can be added to emails and reports
We have added a mustache function which allows you to generate a chart from a curve or timeseries id as an image tag to be inserted into a web page or, in our case, an email.
The mustache code to add a chart is shown below:
{{# create_chart }}curve or timeseries id{{/ create_chart }}
The commentary in the newsletter
The commentary for the newletter is submitted to OpenDataDSL as a HTML snippet with a filename of the format newsletter-yyyy-MM-dd.html
So, in our newletter mustache template, we include it using a mustache include token:
{{> "newsletter-" + #START }}
Note how you can use OpenDataDSL expressions with mustache include tokens
Add the data flows
We need to add an email flow to our report once it has been created, to do this in ODSL code:
// Create the subscription
sub = Subscription()
sub.name = "NEWSLETTER"
sub.enabled = true

// Add the email target with the recipients and subject
sub.addEmailTarget("recipients", "Market Analysis Newsletter", null)

// Add the report as the trigger to send the email
sub.addItem(ref("report", "newsletter"), "newsletter")
save sub
The word recipients needs to be replaced with the email addresses of the users you want to send the test email to
Daily work
The following represents what we need to do in order to publish our newsletter
Validate our smart curve
This is simply checking the data created from our algorithm for the current curve. If there are any anomalies, we may need to tweak our algorithm or inputs.
Write our commentary for the newsletter
For our commentary, I used ChatGPT to generate some newsletter text discussing charts.
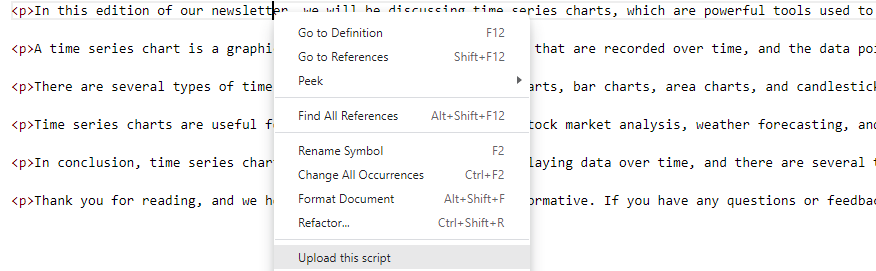
I did a small amount of HTML edits (adding <p> tags around each paragragh) and uploaded the file from VSCode using the Upload this script context menu item from the OpenDataDSL VS Code extension.
The name of the file must match the name syntax we defined in our template, so for the 5th May 2023, it needs to be newsletter-2023-05-05.html
Proof-read the newsletter
We can manually send a sample of the newletter to the people we want to proof-read the newsletter before it gets sent out to our clients by running the following bit of ODSL code:
report = run report newsletter with "between(2023-05-05,2023-05-05)"
sendmail report subject "Newsletter" to "recipients"
The word recipients needs to be replaced with the email addresses of the users you want to send the test email to. Multiple email addresses can be separated with comma, space or semi-colon.
Run the newsletter report to trigger the distribution
Once the proof-readers are happy, we need to run our report for today, this action will trigger the report to be emailed to all our clients.
The report can be run in the OpenDataDSL Portal or the Excel Add-in
To run the report in ODSL code specifying the date we want to run the report for:
save ${report:"newsletter", "_range=between(2023-05-05,2023-05-05)"}
After the report is saved, it will automatically email our newsletter to the configured recipients.
Conclusion
You can see from this example that with a small amount of initial configuration using event data flows, we can reduce the amount of time we spend on a daily basis.
Event-driven data-flows make this possible by performing your custom actions automatically after an event happens thereby reducing time and manual errors.
Next steps
Read Part 2
Part 2 - Validating and publishing trader curves to an ETRM system
Demo
Do you want to see this in action and see how you can benefit from OpenDataDSL?
Fill out the form below, we will contact you to arrange a personally tailored demo.
How about a demo?
Our team is here to find the right solution for you, contact us to see this in action.
Fill out your details below and somebody will be in contact with you very shortly.
More information or free trial?
Tell us about your project, and we can let you know how we can help.
Contact us at info@opendatadsl.com