Data - Facts and Figures


Data insights
In this blog, we show you how to use OpenDataDSL matrices and the ODSL Excel Add-in to gain valuable insights into your data.
Data dependency
Understanding data dependency is important for data analysis and modelling. Data dependency can be measured using statistical methods. One method is the correlation analysis which helps to identify which variables are strongly dependent on each other. Identifying dependencies between variables can help to simplify complex datasets and highlight important relationships.
Bravais-Pearson Correlation Coefficient
The Pearson correlation coefficient, also known as the Bravais-Pearson correlation coefficient, is a measure of the strength and direction of the linear relationship between two variables. It is widely used in statistical analysis and data science to explore the relationship between two variables, and to build predictive models that use one variable to predict the other.
The Pearson correlation coefficient is calculated as the covariance between the two variables divided by the product of their standard deviations. It ranges from -1 to +1, with a value of +1 indicating a perfect positive correlation, a value of -1 indicating a perfect negative correlation, and a value of 0 indicating no correlation.
Analysis of Iberia Electricity Data
As an example we use Iberian Electricity data published by OMIE. Specifically we use electricity prices, purchase and sales volumes for Spain, Portugal and Iberia for the year 2022 on an hourly granularity.
Looking at the data - as an example looking at the first 24 hours of the year 2022 - trying to identify any obvious patterns.
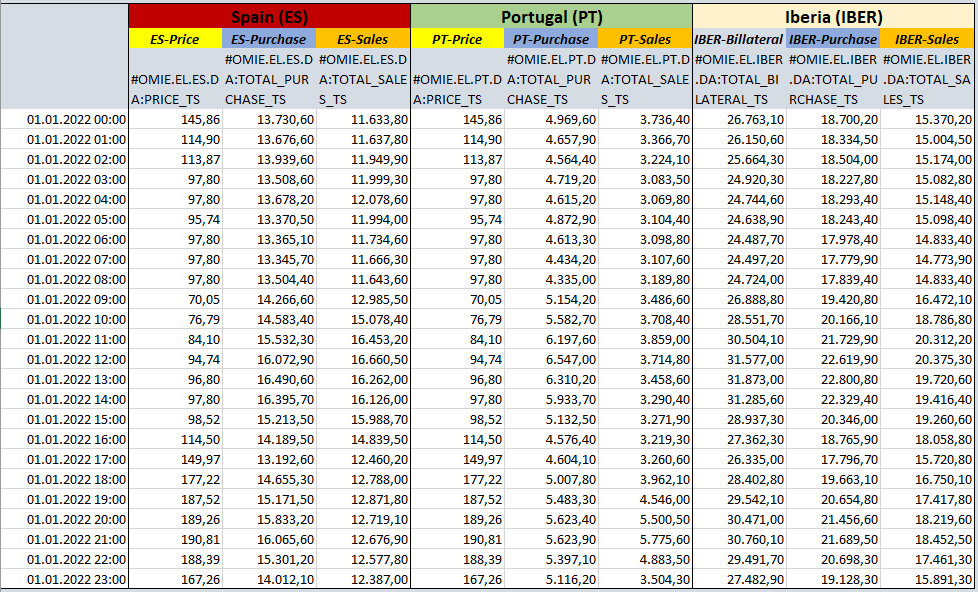
NOTE: I use a German locale which is (.) as a 1000 separator and (,) as a decimal separator.
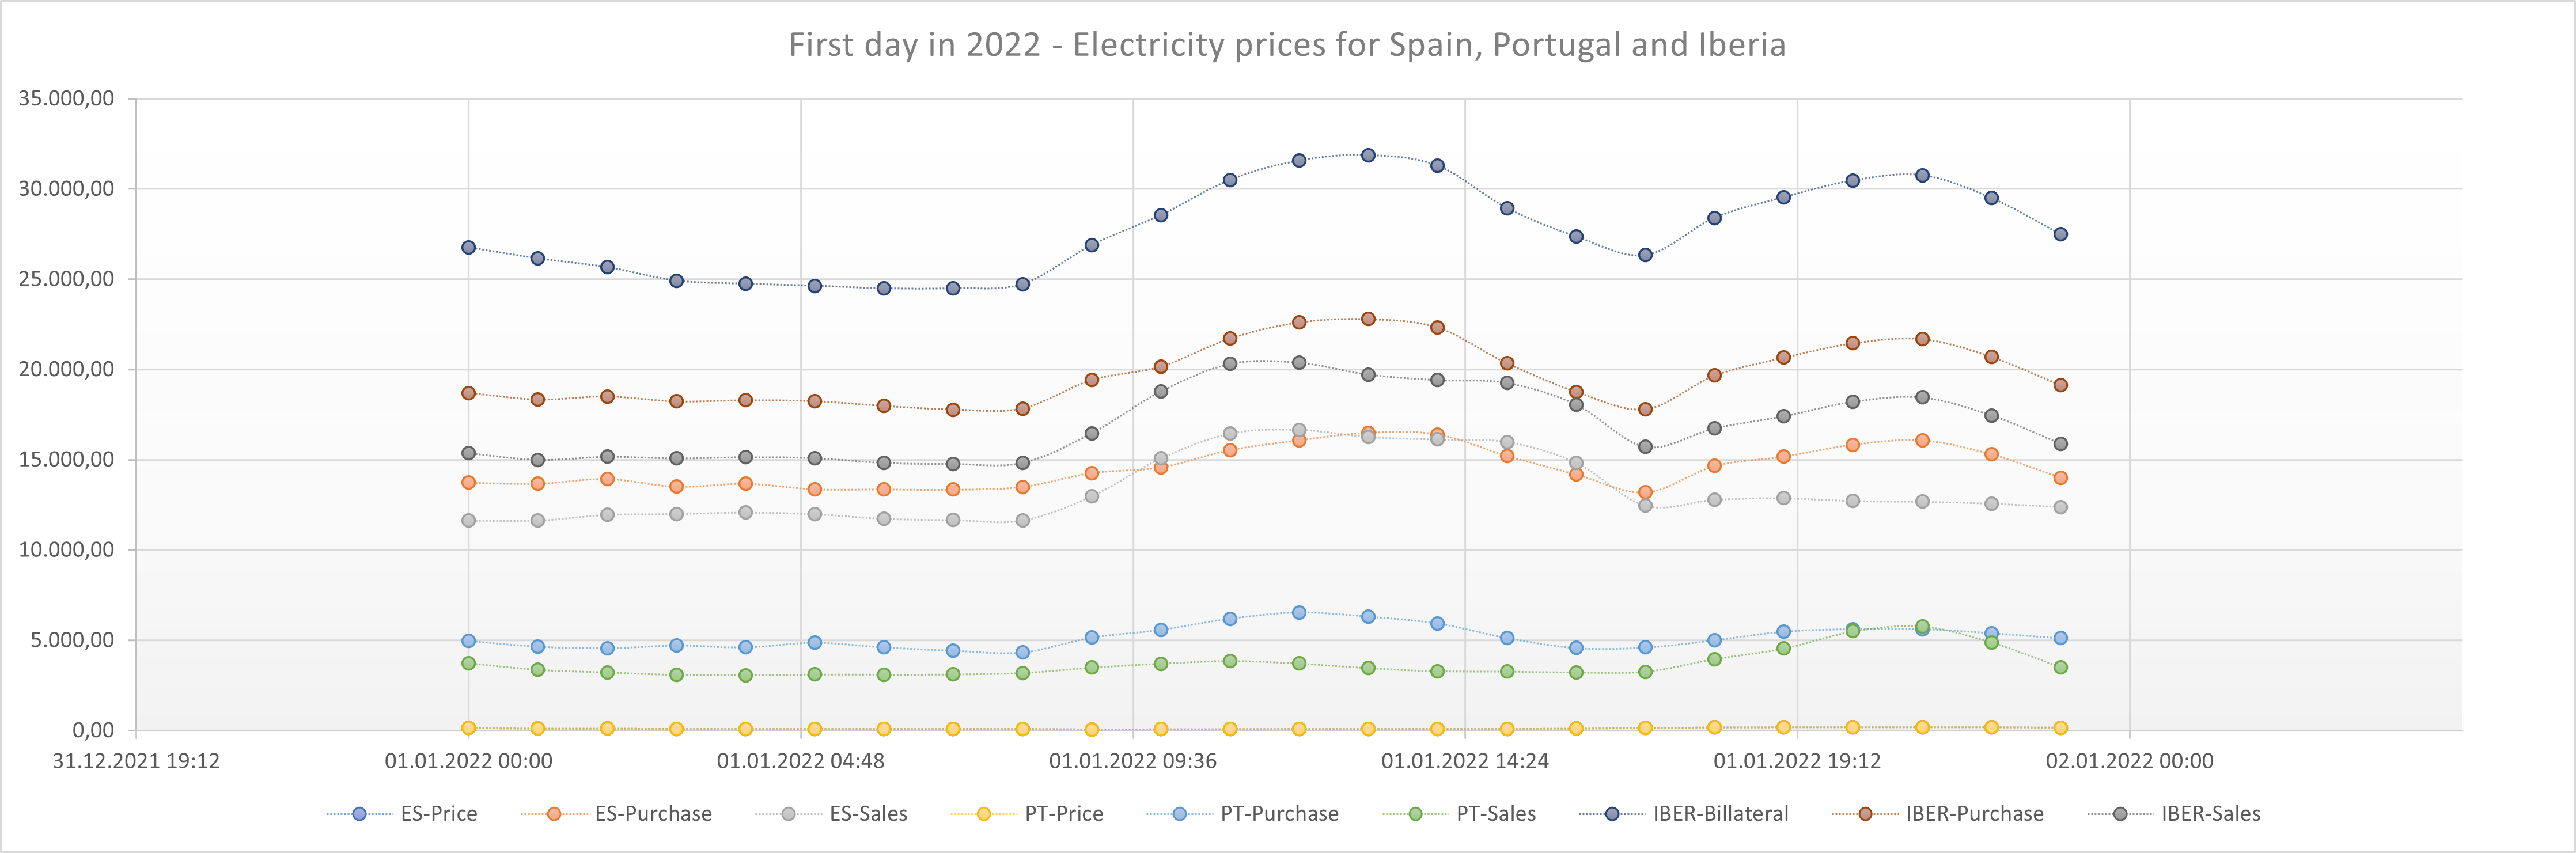
The graphical visualization also helps to get a first impression of the data:
Our Assumptions
Looking at this tiny range of data above, we came up with a few assumptions, which do not necessarily turn out to be true for the entire year of 2022.
Our first assumptions:
- There is a strong dependency between the prices and volumes.
- The Iberian sales volume is the sum of the sales volumes from Spain and Portugal.
- The Iberian purchase volume is the sum of the purchase volumes from Spain and Portugal.
- The prices for Spain and Portugal are identical.
which we check in detail in the following sub-sections.
Correlation Analysis for prices and volumes
A detailed correlation analysis helps to understand the data dependencies.
The correlation matrix can be calculated using an ODSL script (our 4GL script simple programming language). This setup supports calculating the matrix using different time horizons, e.g. month, quarter, year.
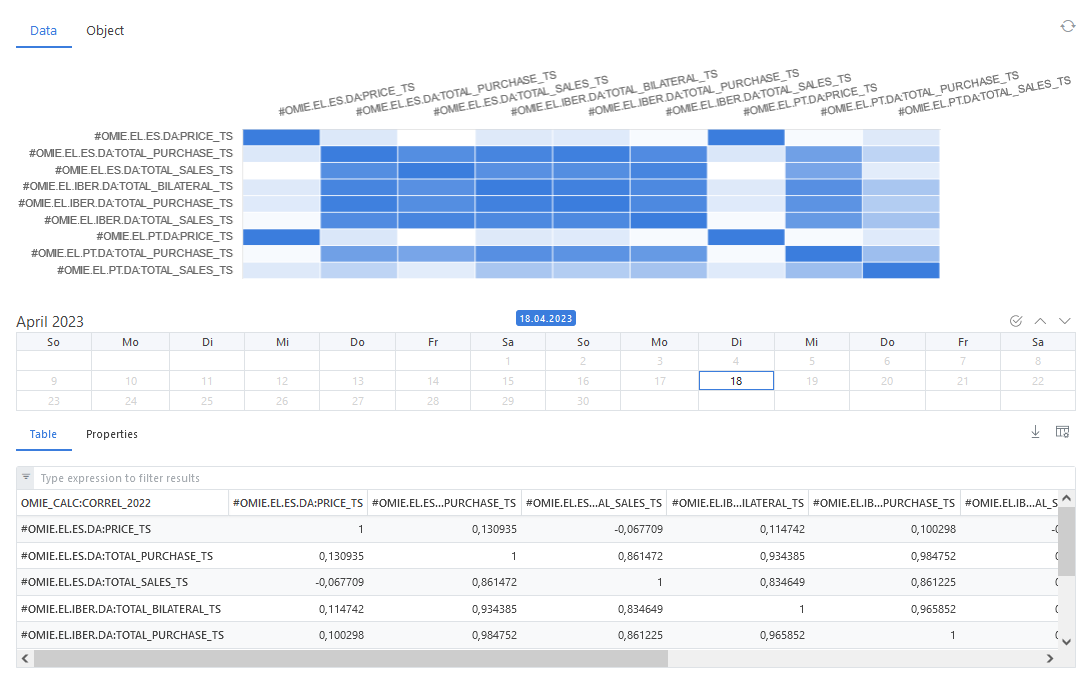
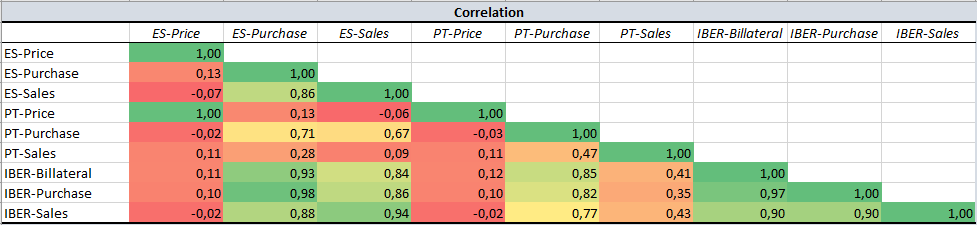
When analysing the Bravais-Pearson correlation coefficients in an Excel overview using the ODSL Excel-Addin to download the data, we find out:
- There is a (almost) perfect dependency between the prices for Spain and Portugal (the correlation coefficient is 1 using 2 digits rounding).
- There is a very low and even negative dependency between the prices and the volumes (correlation coefficient smaller than 0,12).
- There is a high dependency between the Spain sales and also Spain purchase volumes and the Iberian volumes (correlation coefficient between 0,84 and 0,98).
- There is a low dependency between the Spain sales and also Spain purchase volumes and the Portugal volumes (correlation coefficient between -0,06 and 0,71).
- There is a fairly high dependency between the Portugal purchase volumes and the Iberian volumes (correlation coefficient between 0,77 and 0,85).
- There is a fairly low dependency between the Portugal sales volumes and the Iberian volumes (correlation coefficient between 0,35 and 0,43).
- There is a high dependency between the Iberian volumes (correlation coefficient higher than 0,9).
Volumes Aggregations
Using the data for 2022 we can conclude that the sales volume for Iberia is the sum of the sales volumes from Spain and Portugal. And the same works out for the purchase volumes.
Are the prices for Spain and Portugal really identical?
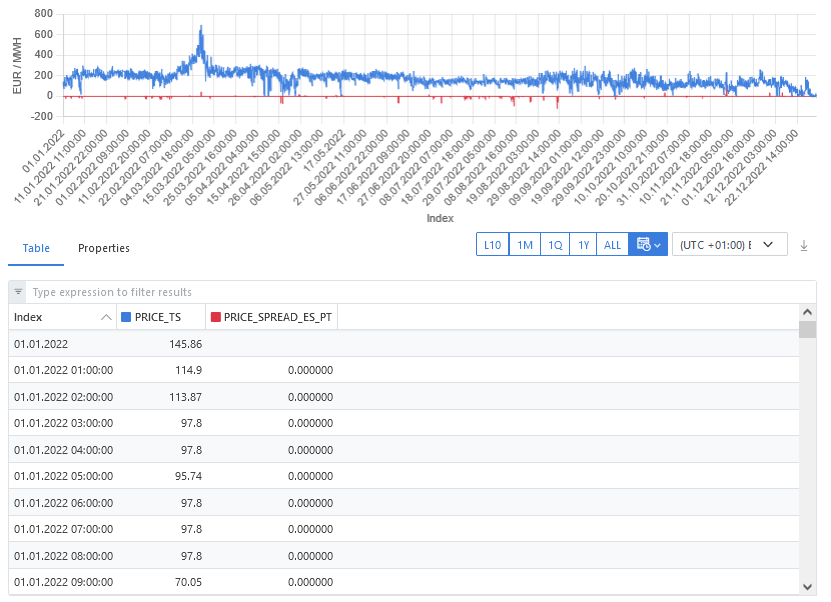
Calculating a spread between the prices for Spain and Portugal should always be 0 in this case. Sure, this can easily be proven or rejected using Excel. But an ODSL smart time series can be used as a basis for notifications in case the user wants to be informed when the spread between the prices for Spain and Portugal is not 0.
Setting up the smart time series and visualizing the spread (red line in the following graph) shows, the prices are not always identical.
Conclusion
Correlation analysis helps to identify dependencies in the data set.
Correlation can also be used to make price forecasts in financial markets by analyzing the relationship between two or more variables that are believed to affect the price. By identifying the variables that have a significant correlation with the price, you can use this information to make informed predictions about the future price movements.
Next steps
Do you want to see this in action and see how you can benefit from OpenDataDSL?
Fill out the form below, we will contact you to arrange a personally tailored demo.
How about a demo?
Our team is here to find the right solution for you, contact us to see this in action.
Fill out your details below and somebody will be in contact with you very shortly.
More information or free trial?
Tell us about your project, and we can let you know how we can help.
Contact us at info@opendatadsl.com