Smart Reports


Smart Reporting
In this blog, we talk about Smart Reports, what they are and how to create them in OpenDataDSL.
We also give an overview of the important aspects and benefits of data reporting in general.
What are data reports?
The purpose of data reporting software is to collect, organize, analyze, and present data in a meaningful way. It enables users to generate reports and visualize data, allowing businesses and individuals to gain insights, make informed decisions, and communicate information effectively.
What are Smart Reports?
The latest innovation from OpenDataDSL is the introduction of Smart Reports, but what are they and how do they differ from normal reports?
Here are some facts about Smart Reports:
- A Smart Report is generated using an ODSL expression
This can be as simple as an arithmetic expression, find or aggregate command or a function call.
- A Smart Report can include a script name
You can use functions from that script in the expression.
- A Smart Report can be styled
You can include a mustache template name in the report configuration to style the report.
- Smart Reports can be manually created
You can manually upload data for a report rather than generating it using an expression.
- A stored Smart Report is dated
A report is run for a specific report date and can use a date range for the input data.
- Smart Reports are versioned
A Smart Report can be run multiple times/day and each run is stored and versioned and can also be tagged.
- A Smart Report can be dynamic
i.e. generated on-the-fly.
- Smart Reports can be scheduled
Each report can be configured with a CRON schedule.
Easy Reports
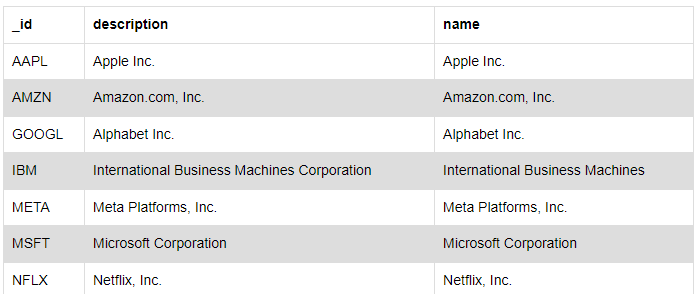
In the simplest form, a Smart Report is an expression, for example a find command:
find ${object} where _type="equity" project name, description
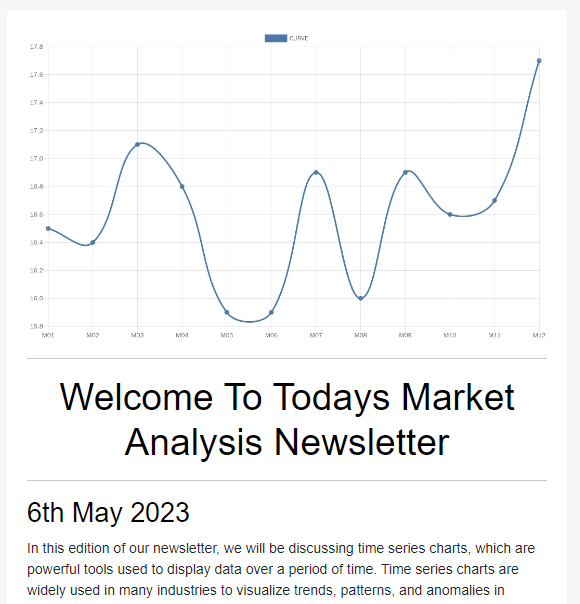
They can include charts generated from curves and timeseries as well as manually updated text :
Complex Reports
Smart Reports can also include more complex calculations and incorporate some very specific display requirements.
Creating complex smart reports comprise of 3 essential elements which effectively split the reporting responsibility between developers, designers and end-users:
- Developers
Use the ODSL language to aggregate, derive and shape the data for the report.
- Designers
Use an enriched version of the mustache logic-less templates to design how the report looks.
- Users
End-users configure the report, selecting which data to use in it.
The Smart part is that both the developer and the designer are simply creating re-usable templates that the end-user selects along with the data they want in the report.
Example report
Statistical analysis of ANY timeseries data
For our example, we want to calculate some basic statistics and a correlation matrix using any timeseries in OpenDataDSL.
The function we use for this is timeseriesComparison with the following syntax:
timeseriesComparison(source, objectQuery, profile, descfield)
- source
The source of the timeseries data (public / private etc).
- objectQuery
The query used to search for the objects containing the data.
- profile
The name of the timeseries to use from the objects.
- descfield
A field in the object to use as the descriptor.
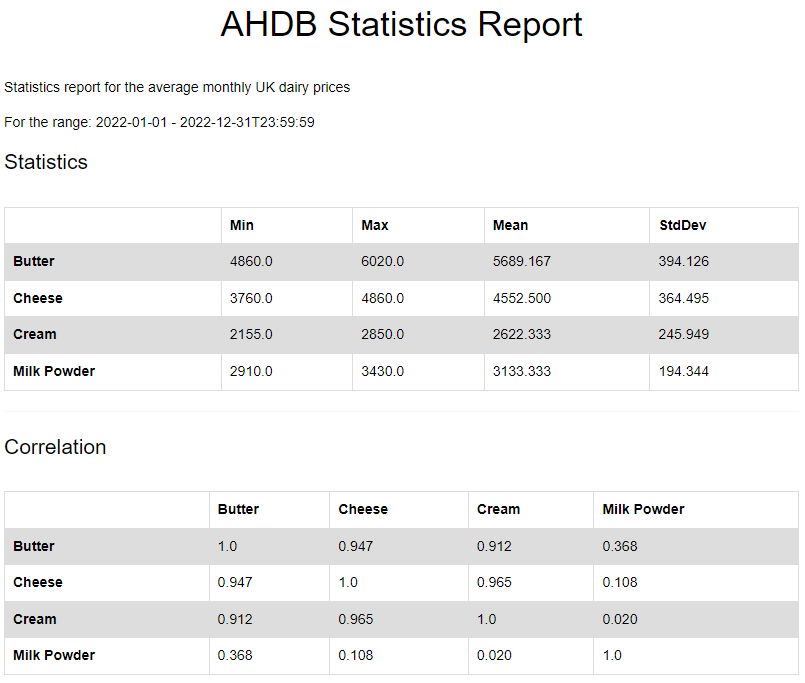
The function creates 2 matrices:
- Statistics
A matrix calculating the minimum, maximum and mean values and the standard deviation for the selected time period.
- Correlation
A correlation matrix show how closely correlated the timeseries are to each other.
Configuring the report
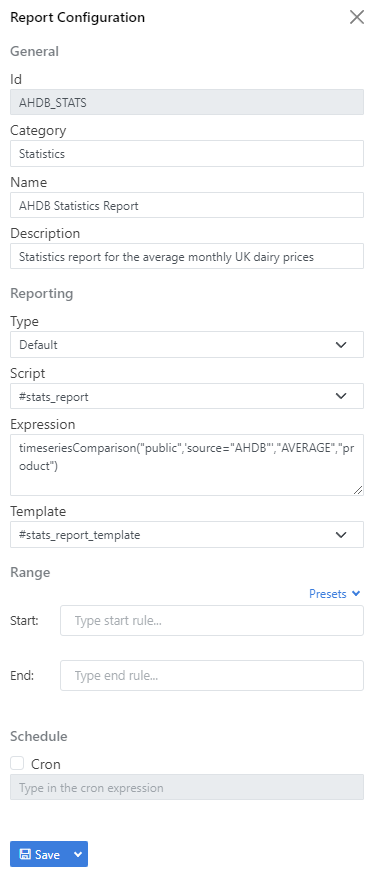
We are going to use average monthly dairy prices from AHDB in the report as an example - it is configured as follows:
- Script
- #stats_report
- Expression
- source = public
- objectQuery = source="AHDB"
- profile = AVERAGE
- descfield = product
- Template
- #stats_report_template
We can configure the report in the portal as show below:
The final report
Smart Report benefits
Here are some key purposes and benefits of Smart Reports:
- Data consolidation
Smart Reports allow you to gather data from various sources and consolidate it into a single, centralized location. This makes it easier to analyze and interpret information.
- Data analysis
Smart Reports are used for analyzing data, applying statistical techniques, and identifying patterns, trends, and relationships within the data. It helps uncover insights that can drive decision-making and improve performance.
- Report generation
Smart Reports enable users to create customized reports based on specific parameters and requirements. It allows for the selection of data elements, formatting options, and visualization techniques to effectively present information.
- Visualization
Smart Reporting involves visualizing data in charts, graphs, tables, and other visual representations. Smart Reports help users understand complex data sets quickly and easily.
- Decision-making support
By providing accurate and timely information, Smart Reports assist in informed decision-making. They enable users to identify areas for improvement, track performance metrics, and evaluate the impact of decisions.
- Collaboration and sharing
Smart Reports facilitate collaboration among team members by allowing users to share reports, dashboards, and insights. It promotes transparency, encourages knowledge sharing, and enhances communication across an organization.
- Compliance and regulation
Many industries have specific reporting requirements and regulatory standards. Smart Reports help ensure compliance by helping users generate reports that meet the necessary criteria.
Conclusion
Overall, Smart Reports empower users to transform raw data into actionable information. They simplify the data analysis process, enhance decision-making capabilities, and improve organizational performance by enabling effective communication and visualization of data.
Next steps
Do you want to see this in action and see how you can benefit from OpenDataDSL?
Fill out the form below, we will contact you to arrange a personally tailored demo.
How about a demo?
Our team is here to find the right solution for you, contact us to see this in action.
Fill out your details below and somebody will be in contact with you very shortly.
More information or free trial?
Tell us about your project, and we can let you know how we can help.
Contact us at info@opendatadsl.com