Forward Curve Insights - Time Spreads


Decoding Forward Curves: Building Market Structure Intelligence with OpenDataDSL
In the fast-paced world of commodity and financial markets, forward curves are more than just price charts — they are rich, multi-dimensional tools that reveal market expectations, inventory pressures, and sentiment dynamics over time.
Whether you're trading oil, metals, or interest rate futures, understanding the shape and structure of the forward curve can provide a significant edge.
Understanding Forward Curve Structures: Contango and Backwardation
At the core of forward curve analysis are two pivotal concepts:
Contango
Contango occurs when future prices are higher than the current spot price. This typically signals an oversupplied market or low near-term demand. Traders often observe contango in the oil markets during periods of high storage capacity - where it’s cheaper to store physical crude and sell at a premium later.
- Signal: Ample supply or weak immediate demand
- Visual Cue: Upward-sloping forward curve
- Example: Crude oil with full storage facilities
Backwardation
In contrast, backwardation is present when future prices are lower than the spot price. It indicates tight current supply or unusually strong demand. Physical shortages, seasonal spikes, or logistical constraints often drive this pricing pattern.
- Signal: Supply shortages or strong current demand
- Visual Cue: Downward-sloping forward curve
- Example: Natural gas during peak winter consumption
These curve structures don’t just guide traders - they’re also essential for risk managers, analysts, and supply chain strategists aiming to understand market dynamics at a deeper level.
Empower Your Analysis with OpenDataDSL
With OpenDataDSL, you gain the power to analyse and visualize forward curves entirely on your own terms - without being tied to upgrade cycles or platform limitations. Whether you're creating quick dashboards or in-depth reports, the flexibility is entirely in your hands.
- Create insight reports that matter to you
- Design custom visualizations using HTML, Mustache, CSS, and JavaScript
- No black boxes - full transparency with your data and code
- Maintain control, from raw data to final insight
Example: Data-Driven Visualizations
A key component of your forward curve insight is chart-based visualization. With OpenDataDSL, you can generate dynamic charts that:
- Display the shape of the forward curve over time
- Overlay rolling time spreads, making contango or backwardation visually obvious
- Use tooltips to show exact spread values and contract information
- Automatically highlight spread direction - positive for contango, negative for backwardation
Forward Curve Shape Meets Insights
Imagine a forward curve with color-coded points and an interactive tooltip. As the user hovers over the curve, the tooltip dynamically shows:
- Contract month
- Contract price
- Time spread
- Market structure (Contango/ Backwardation)
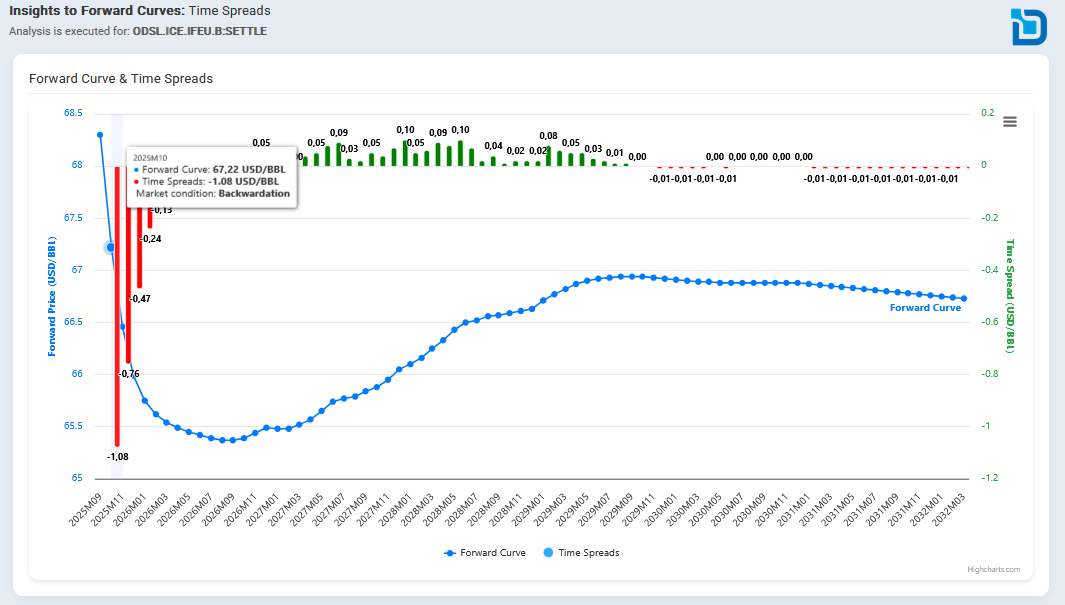 Figure: ICE Brent Forward Curve as of 06 July 2025
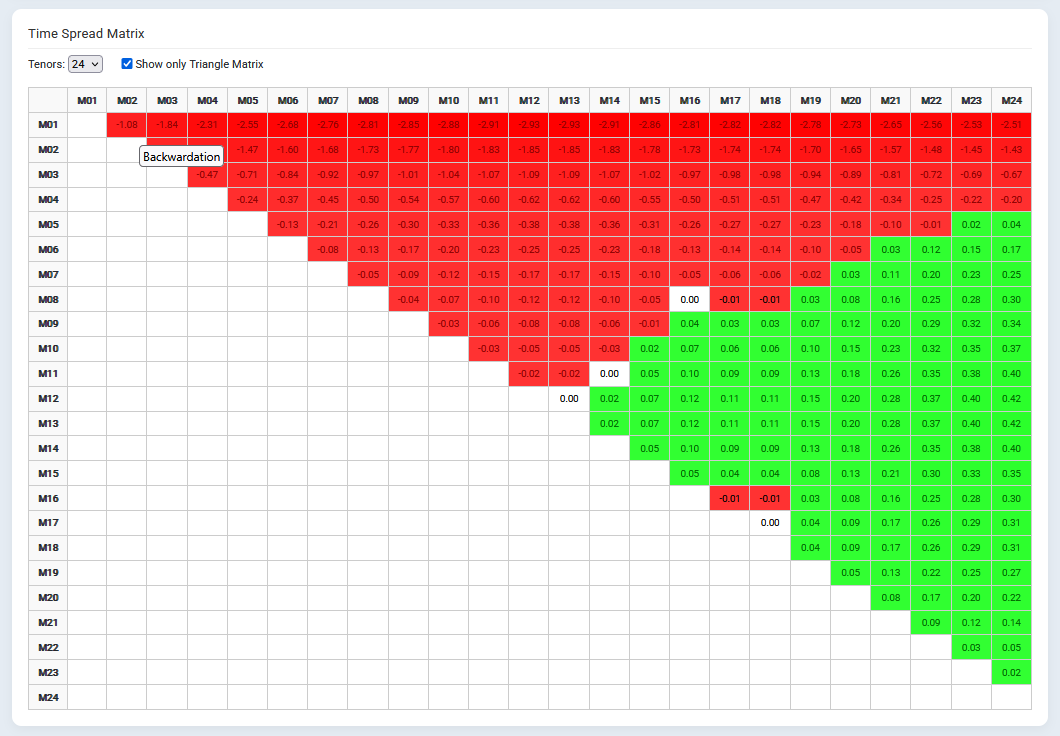
Time Spread Matrix: A Complete View of Market Structure
Take your analysis further by calculating a Time Spread Matrix - a comprehensive table of price differences between all forward contracts.
- Each cell shows the spread between two market contracts
- Negative values indicate backwardation; positive means contango
- Optional upper triangle view removes redundancy, since the matrix mirrors along its diagonal This matrix provides a clear understanding of market sentiment across various timeframes, enabling deeper comparisons and better trade structuring.
Build It Yourself - Or Let Us Help
With OpenDataDSL’s intuitive 4GL syntax and full customization stack, building sophisticated reports is fast and rewarding. But if you'd rather focus on strategy, our team can create bespoke insight reports for you - always outside any upgrade cycle.
Your Data. Your Platform. Your Insight.
With OpenDataDSL, the power of insight creation is truly yours. Whether you're visualizing contango curves, analysing backwardation spreads, or building full market dashboards, you’re never locked in. Your data, your journey - insight without compromise.
OpenDataDSL - Go Beyond the Basics.
Next steps
Do you want to see this in action and see how you can benefit from OpenDataDSL?
Tell us about your project, and we can let you know how we can help.
- Contact us at info@opendatadsl.com
- Sign Up today and become part of the OpenDataDSL community!
- Fill out the form below, we will contact you to arrange a personally tailored demo.
How about a demo?
Our team is here to find the right solution for you, contact us to see this in action.
Fill out your details below and somebody will be in contact with you very shortly.