Your Data should do the Maths

The Case for Smart Data in Energy and Commodities
Every analyst knows the drill. Pull power prices from one source, gas prices from another, dig out the heat rate from a spreadsheet buried in a shared drive, wire it all together in Excel. By the time you’re done, the prices have moved. Rinse and repeat daily.
That’s the hidden cost of dumb data — values with no understanding of what they mean or how they relate. In energy and commodity markets, that gap between raw data and actionable insight is where time, accuracy, and competitive edge quietly bleed out.
Smart Data fixes that.
What is Smart Data?
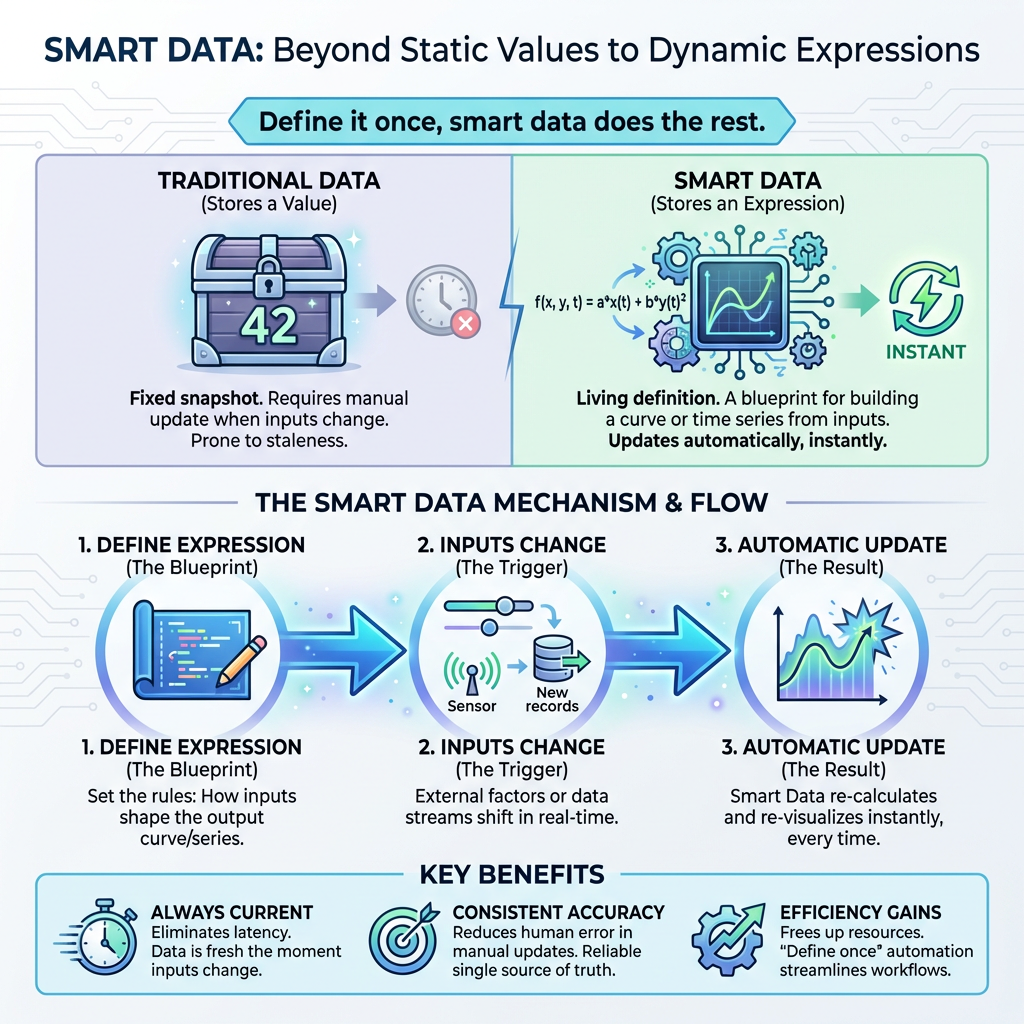
Smart Data doesn’t just store a value — it stores an expression. A definition of how a curve or time series should be built from its inputs. When those inputs change, the Smart Data updates. Automatically. Instantly. Every time.
Define it once. The platform does the rest.
The Spreads Problem
Spread calculations aren’t generic. They’re deeply proprietary.
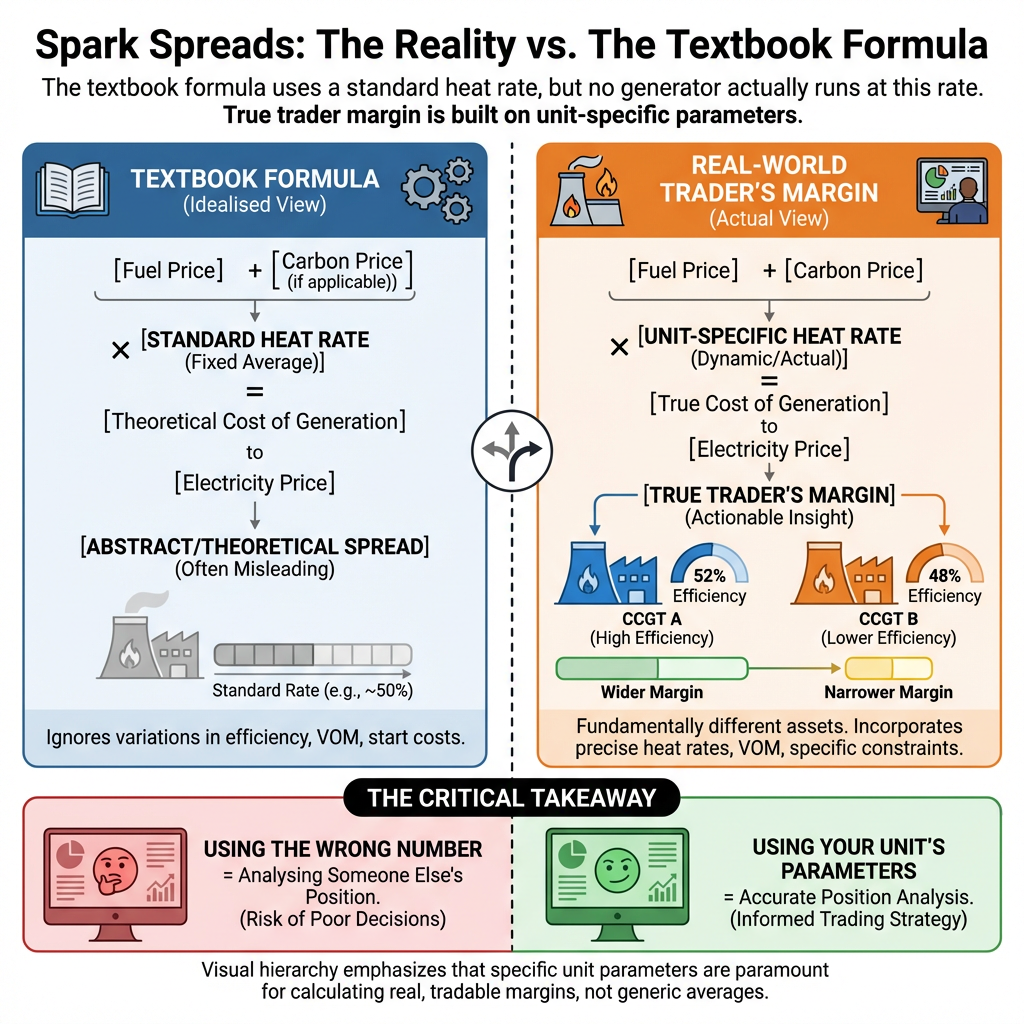
Take spark spreads. The textbook formula uses a standard heat rate — but no generator actually runs at the textbook rate. A CCGT at 52% efficiency is a fundamentally different asset to one at 48%. The spread that matters to a generation trader is their margin, built on their unit’s parameters. Use the wrong number and you’re not analysing your position — you’re analysing someone else’s.
Same story for dark spreads, where carbon price and fuel intensity add further specificity. Or crack spreads, where output mix varies by refinery and shifts with the margin environment.
When this logic lives in spreadsheets or bespoke scripts, it’s fragile. Hard to audit. Impossible to version. And when a parameter changes — unit refurbishment, new feedstock, revised carbon factor — you’re into manual cascading updates. Error-prone by design.
Smart Data makes the calculation part of the data itself. A smart spark spread references the power price, gas price, and your specific heat rate as a defined platform object. Update the heat rate and everything downstream updates with it. Job done.
Beyond Spreads: Curated Data for Models
The same logic scales well beyond bilateral spreads.
Market analysts and risk managers depend on a stack of derived inputs — regional price averages, cross-border spreads, load-weighted prices, rolling correlations, seasonal indices. In most setups, analysts either crunch these themselves every time they’re needed, or wait on a data team to produce them. Either way, it’s a bottleneck.
With Smart Data, analysts define the series once, store them alongside source data, and reference them like any other feed. The platform handles recalculation. The analyst owns the logic. And it’s versioned — methodology changes leave an audit trail.
In regulated environments, that’s not a nice-to-have. If your risk model uses a load-weighted regional power price, you need to show exactly how it was built — and that it was built consistently. Every time.
Bridging the Frequency Gap: 15-Minute Markets, Hourly Systems
European power markets have largely moved to 15-minute settlement. EPEX, Nord Pool — quarter-hourly is now standard. For intraday traders, great. For the rest of the organisation — risk systems, ERP platforms, reporting tools, downstream models — it’s a headache.
Legacy systems expect hourly data. Redesigning them is a multi-year IT programme nobody has budget for. So someone bridges the gap. Usually an analyst running an aggregation script. Or worse, an Excel sheet averaging four quarter-hourly prices into one.
One OpenDataDSL client hit this exact problem. As sources migrated to 15-minute frequency, their downstream systems still needed clean hourly series. The fix: Smart Time Series that aggregate quarter-hourly inputs into hourly values automatically, using the right averaging logic for each series. The hourly data is available to every downstream system the moment the 15-minute data lands — the aggregation fires as part of the ELT post-load process, not as a separate downstream job. No manual steps. No lag. No stale scripts.
And when those legacy systems eventually do support sub-hourly data, one Smart Data definition gets retired — not a dozen spreadsheets tracked down across the organisation.
Procurement and Commercial Intelligence
For procurement teams and commercial analysts, the play is slightly different — but equally compelling.
Build indicators that reflect your exposure, not a generic benchmark. A procurement advisory firm might track a custom basket of energy prices weighted by client geography and contract mix. An industrial buyer might want a rolling hedge indicator blending spot and forward prices in proportions that match their purchasing strategy. A utility commercial team might want all-in generation cost — fuel, carbon, variable O&M — as a single series, not three sources reconciled by hand each week.
Define it once. Let it run.
What This Really Means
Smart Data isn’t just an efficiency play, though the time savings are real. It’s about where analytical expertise lives in the organisation.
When methodology lives in a spreadsheet, it walks out the door with the person who built it. Teams silo. Reproducing someone’s analysis means reconstructing their logic from scratch — with all the subtle drift that introduces.
When it’s encoded as a Smart Data definition, it becomes institutional knowledge. Documented. Reproducible. Accessible to anyone with the right permissions. The next analyst inherits the spark spread — and understands exactly how it works.
That’s the real value: an analytical capability that’s durable and scalable in a way spreadsheet workflows can never be.
Getting Started
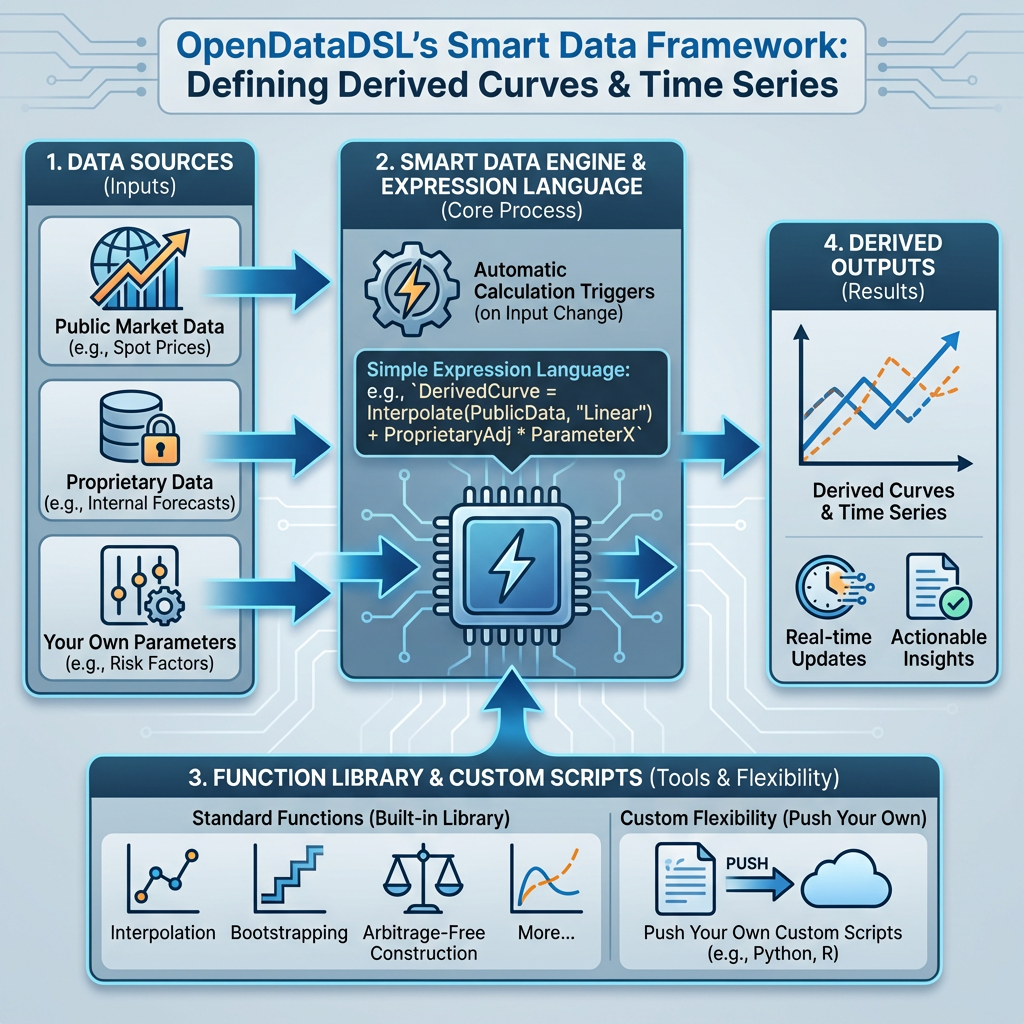
OpenDataDSL’s Smart Data framework lets you define derived curves and time series using a simple expression language — pulling from public market data, proprietary data, or your own parameters. Calculations trigger automatically when inputs change. The platform’s function library covers interpolation, bootstrapping, arbitrage-free curve construction, and more. And when standard methods don’t fit, push your own custom scripts to the platform.
Generation margin indicators, regional price aggregates, refinery margin benchmarks — Smart Data manages derived data with the same rigour as the source data underneath it.
Because the insight is only as good as the data behind it. And that data should be working for you.
It's not just a better pattern for energy data. It's the correct one.
OpenDataDSL provides a commodity data platform and Fusion AI assistant suite purpose-built for energy and commodity trading organisations. To learn more about how we handle data enrichment and integration
Fill out the form below, we will contact you to arrange a personally tailored demo.
How about a demo?
Our team is here to find the right solution for you, contact us to see this in action.
Fill out your details below and somebody will be in contact with you very shortly.