How to Navigate Market Shocks

When the Strait Closes
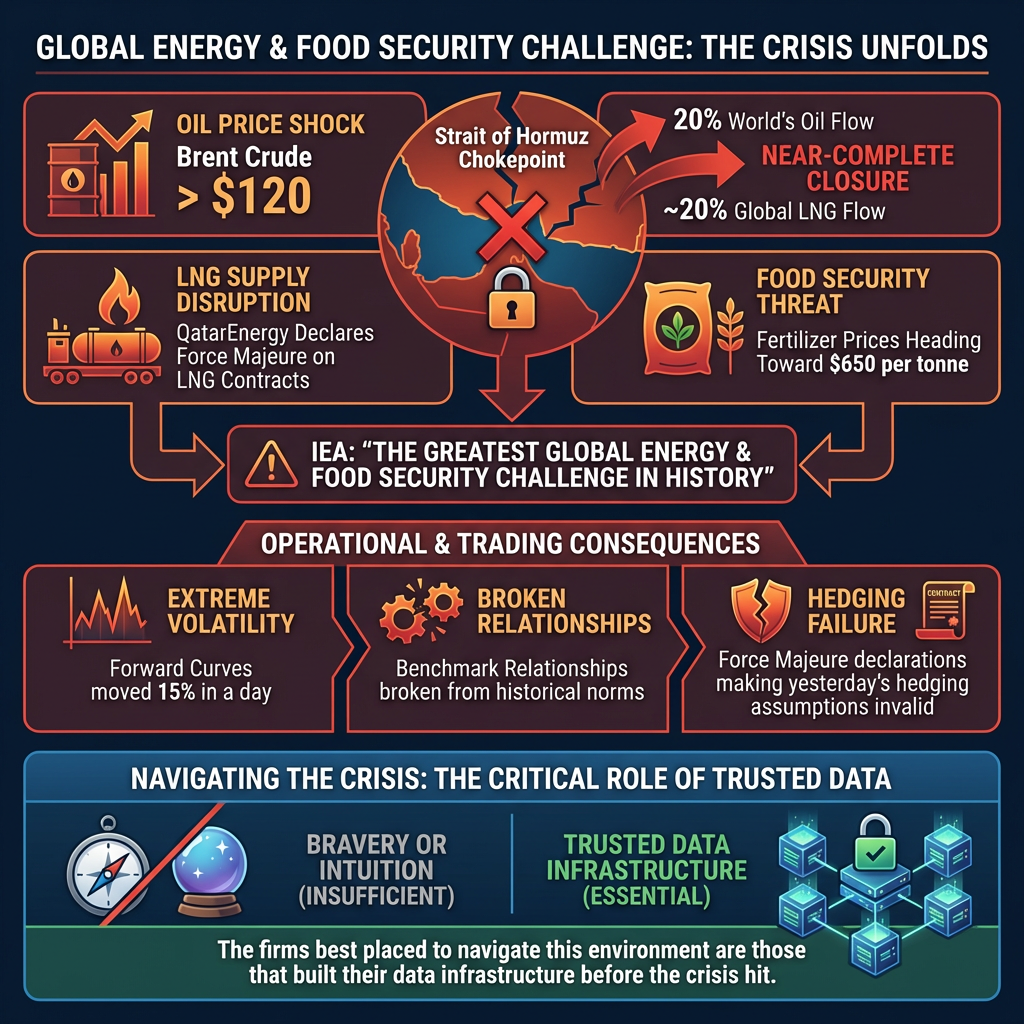
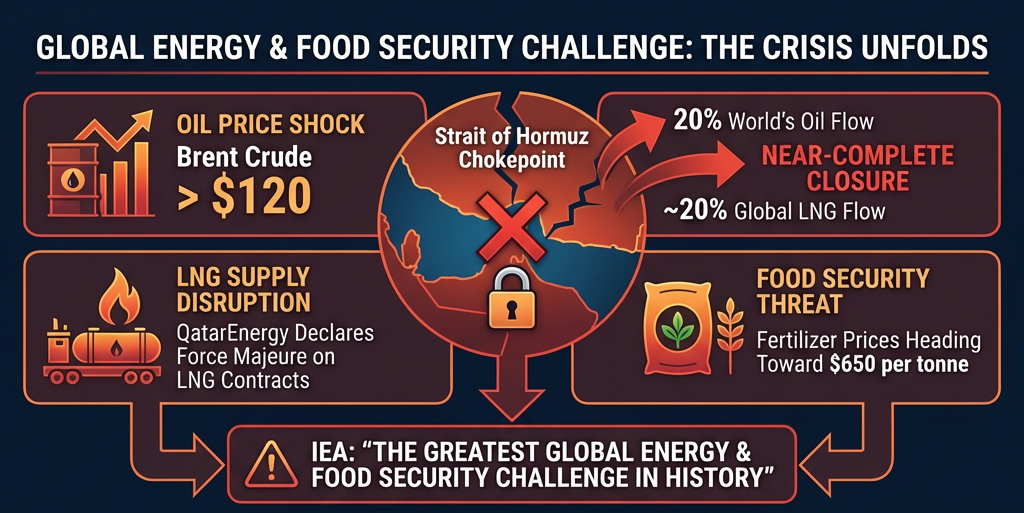
Brent crude above $120. QatarEnergy declaring Force Majeure on LNG contracts. Fertilizer prices heading toward $650 per tonne. The near-complete closure of the Strait of Hormuz, the chokepoint through which 20% of the world's oil and one-fifth of global LNG normally flows, has created what the IEA is calling “The greatest global energy and food security challenge in history.”
In crisis conditions like these, your ability to trade, hedge, and manage exposure doesn't depend on bravery or market intuition alone. It depends on whether you can trust your data. Forward curves that moved 15% in a day. Benchmark relationships that have broken from historical norms. Force majeure declarations making yesterday’s hedging assumptions invalid. The firms best placed to navigate this environment are those that built their data infrastructure before the crisis hit.
The data problems no-one planned for
Most commodity risk systems were stress-tested against 2008 and 2022 scenarios — sharp moves, yes, but ones where the supply chain itself remained fundamentally intact. The 2026 Iran conflict is categorically different. It is not a price shock layered over a functioning market. It is a physical chokepoint closure that has removed the market’s adjustment mechanisms. For data and analytics teams, this creates challenges across every dimension of the trading workflow:
Forward curves that defy history
Brent opened 2026 at $61 per barrel and is currently trading above $120 — a near-doubling in under eight weeks. The forward curve has moved from moderate backwardation into extreme structures as the market prices in both near-term scarcity and long-term structural uncertainty. Curve models trained on historical relationships have broken down. Any firm relying on statically built or infrequently refreshed forward curves is flying blind.
Benchmarks under stress
The three main crude benchmarks — Brent, WTI, and Dubai — along with LNG benchmarks, crack spreads, and freight rates, are all repricing simultaneously and in non-linear ways. The WTI-Brent spread has blown out as US producers aggressively hedge the back end of the WTI curve. Firms without a unified, real-time view of how their reference prices are moving relative to each other are exposed to basis risk they cannot see.
Force Majeure cascades
QatarEnergy’s Force Majeure declaration on LNG contracts — and the weeks-long restart timeline for cryogenic LNG facilities even if the conflict de-escalates — means that contract price structures and hedging assumptions across Asian and European gas portfolios are suddenly invalid. The data question is: how quickly can your systems reflect the new reality, and how traceable is every assumption in your forward curve back to its source?
The food-energy nexus
The Strait of Hormuz is not just an energy chokepoint. Gulf states account for roughly 45% of global sulfur supply — a critical input to fertilizer production. With sulfur disrupted and natural gas prices spiking (gas is the primary feedstock for nitrogen fertilizers), the agricultural commodity complex has been pulled into the energy shock. Wheat, corn, and soy prices are all moving on energy inputs, not just weather. This energy-grain linkage is forcing commodity firms and trading houses to manage correlations and derived data relationships that their systems were never designed to track in real time.
The firms navigating this crisis most effectively are not those with the most sophisticated models. They are those with the most trustworthy, traceable, and rapidly-updating data foundations.
What data-ready looks like in a crisis
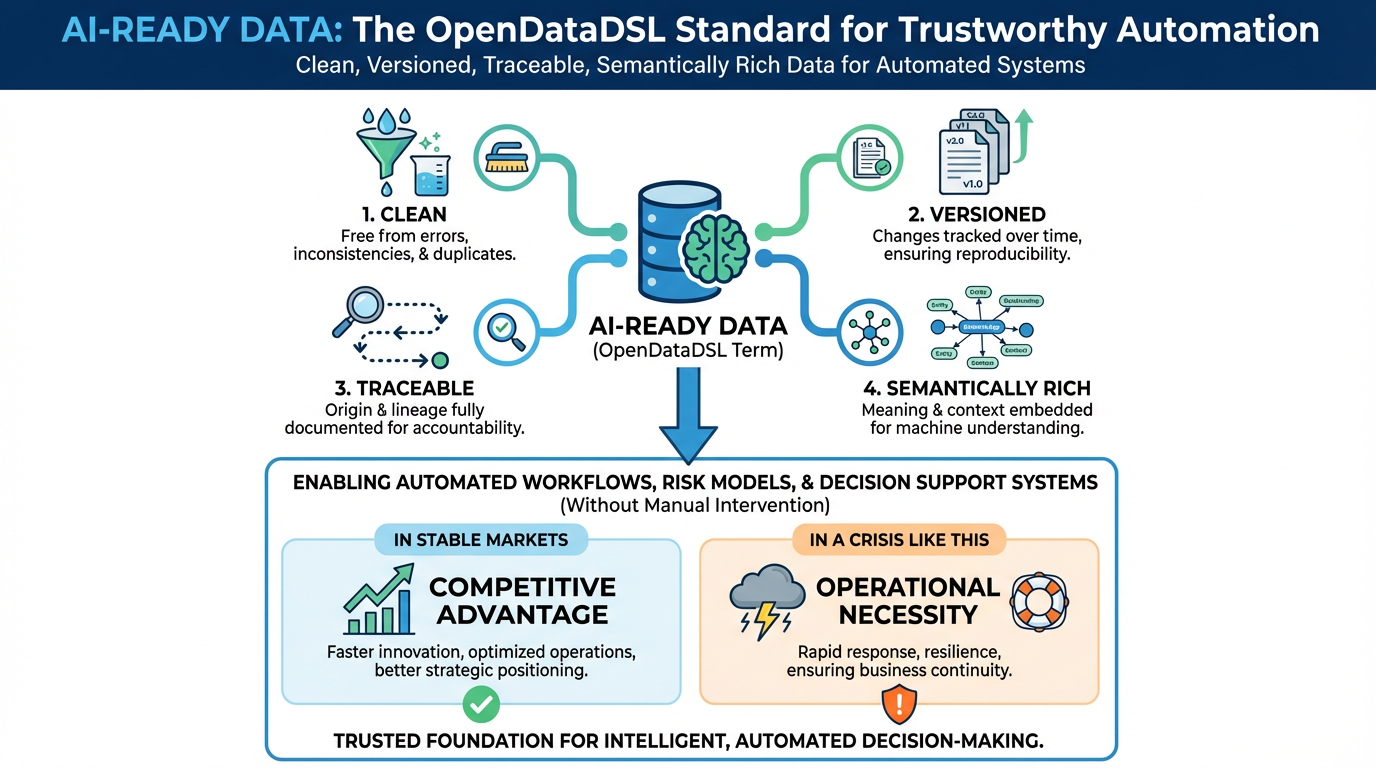
At OpenDataDSL, we use a specific term for this: AI-ready data — data that is clean, versioned, traceable, and semantically rich enough to be trusted in automated workflows, risk models, and decision support systems without manual intervention. In stable markets, that capability is a competitive advantage. In a crisis like this, it is a operational necessity. Here is what data-readiness looks like in practice during a period of extreme commodity volatility:
Brent Curve
When the Brent curve moved 15% in a single session, the question every risk manager needed to answer was: ‘what did our curve look like before this move, and what hedges did we put on based on it?’ ODSL stores every version of every forward curve with complete provenance — when it was built, from which source data, and by which process. You can reconstruct any curve at any point in time, which means you can explain any position.
Crack Spreads
Crack spreads, regional basis differentials, fertilizer-energy correlations, freight-adjusted netbacks: these are not static calculations. ODSL’s formula engine computes derived data automatically as underlying benchmarks update, and stores the full lineage — so when a crack spread widens from $18 to $45 in a week, your system knows why, and that reasoning is auditable. Smart data, not just raw data.
PRA Assessments
Platts and Argus assessments, exchange settlements, broker screens: in a crisis these sources diverge. ODSL aggregates and normalizes across all of them, flags anomalies, and surfaces the divergence for human review rather than silently propagating a stale or erroneous reference price into downstream systems like ETRMs, risk engines, and P&L reports.
Auditability When It Matters Most
The difference matters acutely in crisis conditions. When you need to explain to a counterparty, a regulator, or your own risk committee why a particular reference price was used in a contract — and that price is now contested — you need to be able to trace it back to the raw source, not just accept the output of an opaque transformation pipeline. ODSL’s ELT approach keeps the raw data intact and the transformation logic explicit and auditable.
One Platform, Every Market
The energy-food linkage that has emerged from the Hormuz closure means that oil traders suddenly need to understand natural gas, fertilizer, and agricultural forward curves. Firms running separate, siloed data systems for energy and commodities are discovering that integration gap the hard way. ODSL’s platform model handles crude, LNG, power, metals, agricultural commodities, and freight in a single environment with a consistent data model and API.
OpenDataDSL capabilities: built for exactly this
| OpenDataDSL capability | What it delivers under volatility |
|---|---|
| Versioned forward curves | Every curve version stored with full provenance. Reconstruct any curve at any historical point. Contango/backwardation signals automated. |
| Derived / smart data engine | Crack spreads, basis differentials, energy-grain correlations and netbacks computed automatically and stored with lineage as underlying benchmarks update. |
| Multi-source benchmark aggregation | Platts, Argus, exchange settlements, broker screens normalized into a single consistent reference price layer. Divergence flagged for review. |
| ELT data traceability | Raw source data preserved alongside transformations. Every reference price is fully auditable back to origin — critical for position dispute resolution. |
| ETRM / system integration | Clean, normalized market data delivered via REST, Python, JavaScript or ODSL APIs directly to Molecule, Openlink, Aspect and other downstream systems. |
| Multi-commodity platform | Oil, LNG, power, metals, fertilizers, and agricultural commodities in one extensible platform. Built for the cross-commodity correlations that crises expose. |
The window to act is now
The Strait of Hormuz will reopen. Curves will restabilize. The geopolitical risk premium will eventually be priced in or priced out. But the firms that built their data infrastructure during the crisis, or were already running on a trusted, extensible platform when it started, will emerge with a permanent structural advantage.
Every crisis reveals the latent weaknesses in the systems we built in calmer times. The question for 2026 and beyond is not whether you can handle volatility — it’s whether your data infrastructure can. Forward curves that update in real time. Derived data that computes automatically. Reference prices that are traceable to their source. Multi-commodity coverage that reflects how markets actually interact under stress.
That is what OpenDataDSL was built for. Not for the quiet weeks when nothing moves, but for the weeks when everything moves at once.
Request a platform walkthrough focused on your specific commodity and data workflow - from forward curve management and crack spread analytics to ETRM integration and multi-source benchmark aggregation.
www.opendatadsl.com | Start free | No infrastructure required
Fill out the form below, we will contact you to arrange a personally tailored demo.
How about a demo?
Our team is here to find the right solution for you, contact us to see this in action.
Fill out your details below and somebody will be in contact with you very shortly.