Composer - Your Market Views, Built in Minutes and Kept Up to Date

Introducing Composer
Every energy and commodity team has a set of views it looks at every day: spreads, margins, curves in another currency, the front month as a history. Most of them are built in spreadsheets.
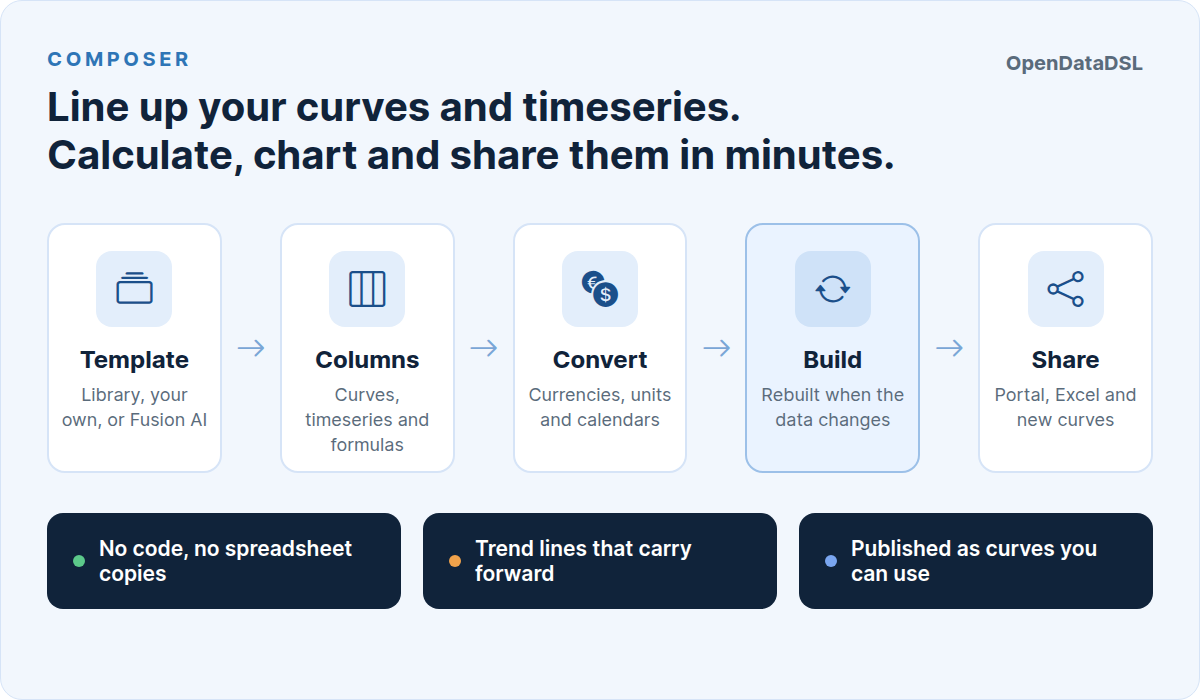
Composer builds them on the OpenDataDSL platform instead: line up curves and timeseries side by side, calculate what you need, and chart it, with no code and no copies of the data, rebuilt every time the data changes.
The views that live in spreadsheets
Ask an analyst what they look at first thing in the morning and the answer is rarely a single price. It is a comparison:
- The NBP premium over TTF, month by month
- The clean spark spread for the next two winters
- A dollar curve converted to euros per MWh
- How the front month has traded over the last quarter
- What a fixed price hedge is worth against today's curve
Each of these is simple to work out, and that is exactly why they end up in spreadsheets. Someone copies the curves in, writes a few formulas, adds a chart, and the sheet becomes part of the morning routine.
Then the problems start. The data has to be pasted in again every day. Formulas point at the wrong row when the front month rolls. A currency is converted with a rate someone typed in last week. The chart breaks when a tenor is missing. And the whole thing lives on one laptop, so nobody else can check it, reuse it, or rely on it when its owner is away.
What is a composition?
A composition is a worksheet on the platform. It is either a curve worksheet, where the rows are tenors (M01, M02, Q01 ...) for one ondate, or a timeseries worksheet, where the rows are dates. Every column is lined up on those rows, and each column is one of three kinds:
| Column | What it is | Example |
|---|---|---|
| Data | A curve, a timeseries, or one tenor of a curve as a daily history | ICE.ENDEX.TTF:SETTLE |
| Expression | A formula using the other columns' ids, functions and your own scripts | NBP - TTF |
| Linked | A column of another saved composition | GAS_POWER:TTF_VS_NBP/SPREAD |
Composer converts each column to the currency, units and calendar you choose, using your organisation's FX rates, so prices in pence per therm, dollars per barrel and euros per tonne can sit side by side and be compared like for like.
A worked example: the clean spark spread
The clean spark spread is what a gas-fired power plant earns for each MWh it generates, after buying the gas and the carbon allowances it needs. In Composer it takes four columns:
- DE baseload: the German baseload power curve.
- TTF: the gas curve.
- EUA: the carbon curve.
- Clean spark: an expression,
POWER - GAS / 0.55 - 0.37 * CO2, for a plant that is 55% efficient and emits 0.37 tonnes of CO2 per MWh.
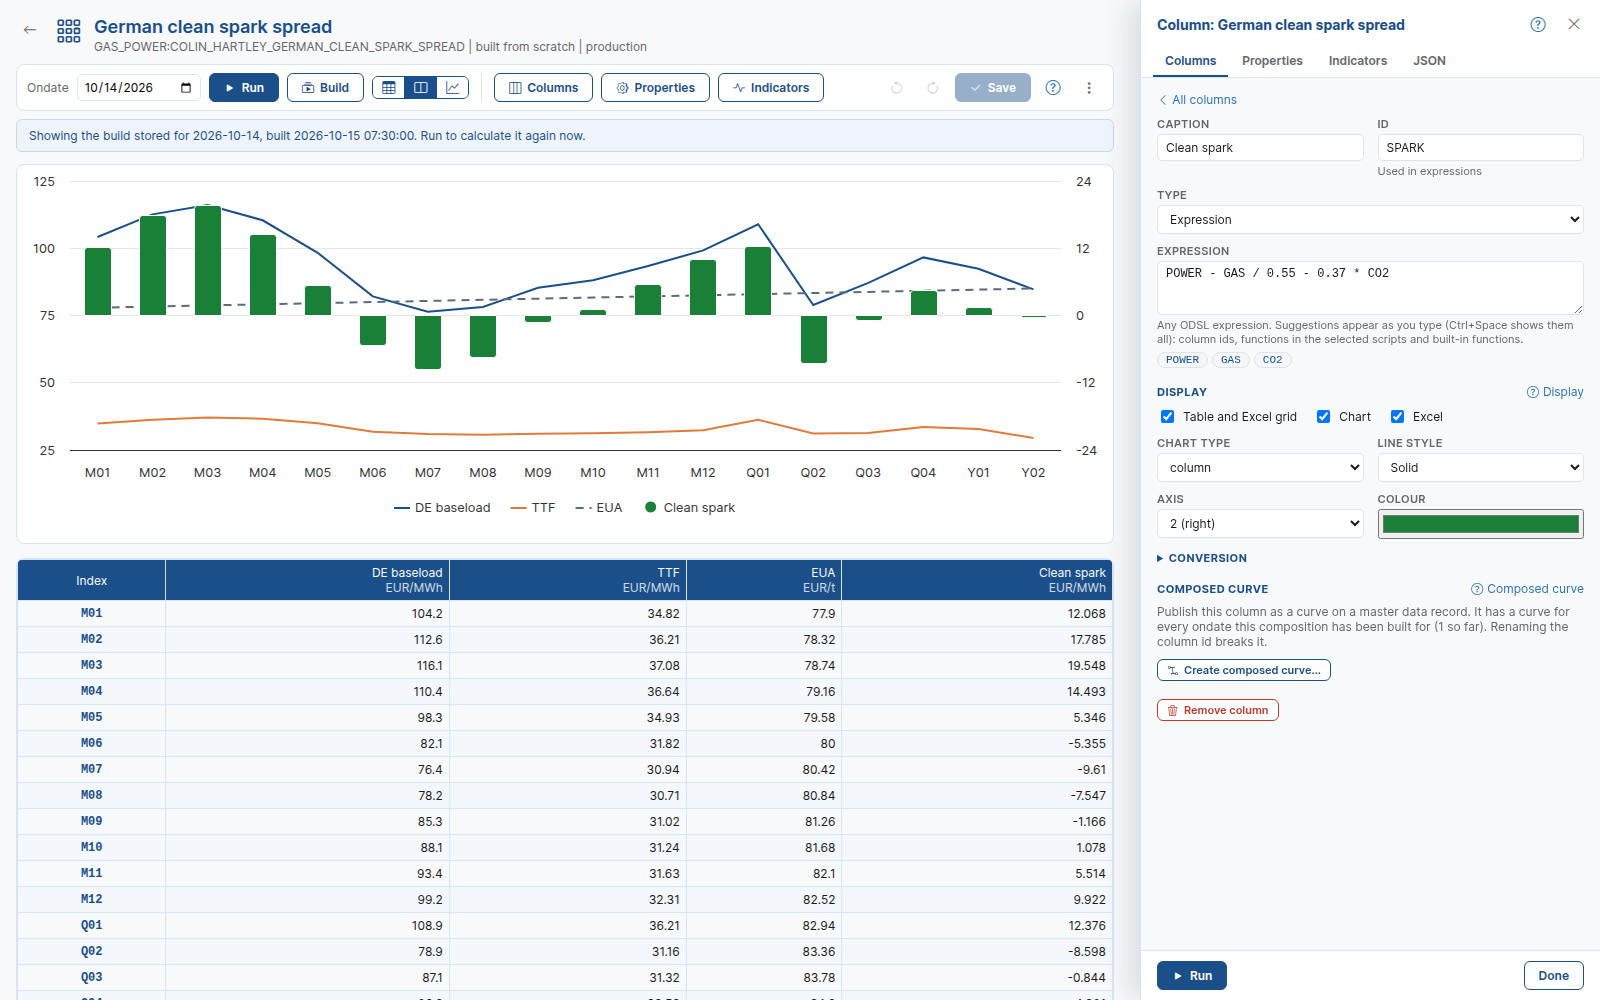
The data is the focus: a chart and a table for the ondate you pick. Everything else is edited in the panel beside it, so you see each change as you make it. The expression editor suggests the column ids, built-in functions and functions from your own scripts as you type, and shows their parameters. Every change can be undone.
You do not even need to build it yourself: Clean spark spread is one of the 50 templates in the OpenDataDSL library. Choose it, pick your power, gas and carbon curves, and it is ready.
Kept up to date, automatically
A spreadsheet is only as current as the last time someone refreshed it. A saved composition looks after itself:
- Builds: each day's result is stored, so opening a composition, or reading it in the portal or Excel, shows that day straight away. Build a range of past days in one go to fill in the history.
- Automation: when one of the curves or timeseries a composition reads is updated, the composition is rebuilt for that day. Compositions that link to it are rebuilt after it.
- Composed curves and timeseries: any column can be published as a curve or timeseries in its own right. A spread built in Composer becomes a curve your scripts, other compositions, automations and reports can use like any other, with automations of its own.
So the NBP premium, the clean spark spread and the converted curves are ready by the time the team sits down, without anyone opening a spreadsheet.
And when someone does want a spreadsheet, every composition opens in the OpenDataDSL Excel Add-in as a clean table: a row for each tenor or date, and only the columns marked for Excel. The working columns that feed a spread stay out of the way, and the numbers are ready to calculate with.
Chart indicators that carry forward
Analysts do not just look at a chart: they draw on it. Composer lets you add trend lines and levels by clicking on the chart, and moving averages, exponential moving averages, Bollinger bands and linear regressions calculated from any column.
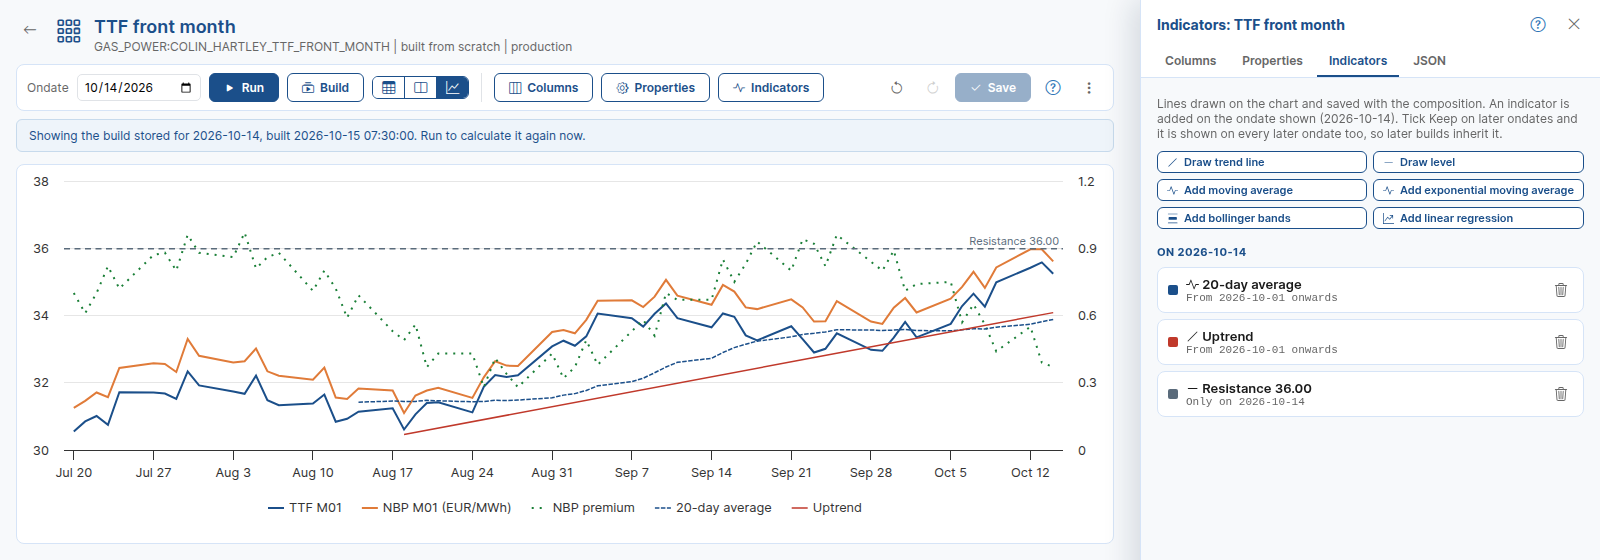
Indicators are saved with the composition and belong to the day they were added. Tick Keep on later ondates, and a trend line drawn on yesterday's composition is still there on today's build, and on every build after it, until you remove it from that day on. The same indicators appear when the composition is opened as a report in the portal.
A gallery for every analytics area
Compositions are stored in analytics areas, such as gas and power, oil, or a trading desk. The Composer Gallery shows an area as a board of live charts, one card per composition, each showing its latest build.
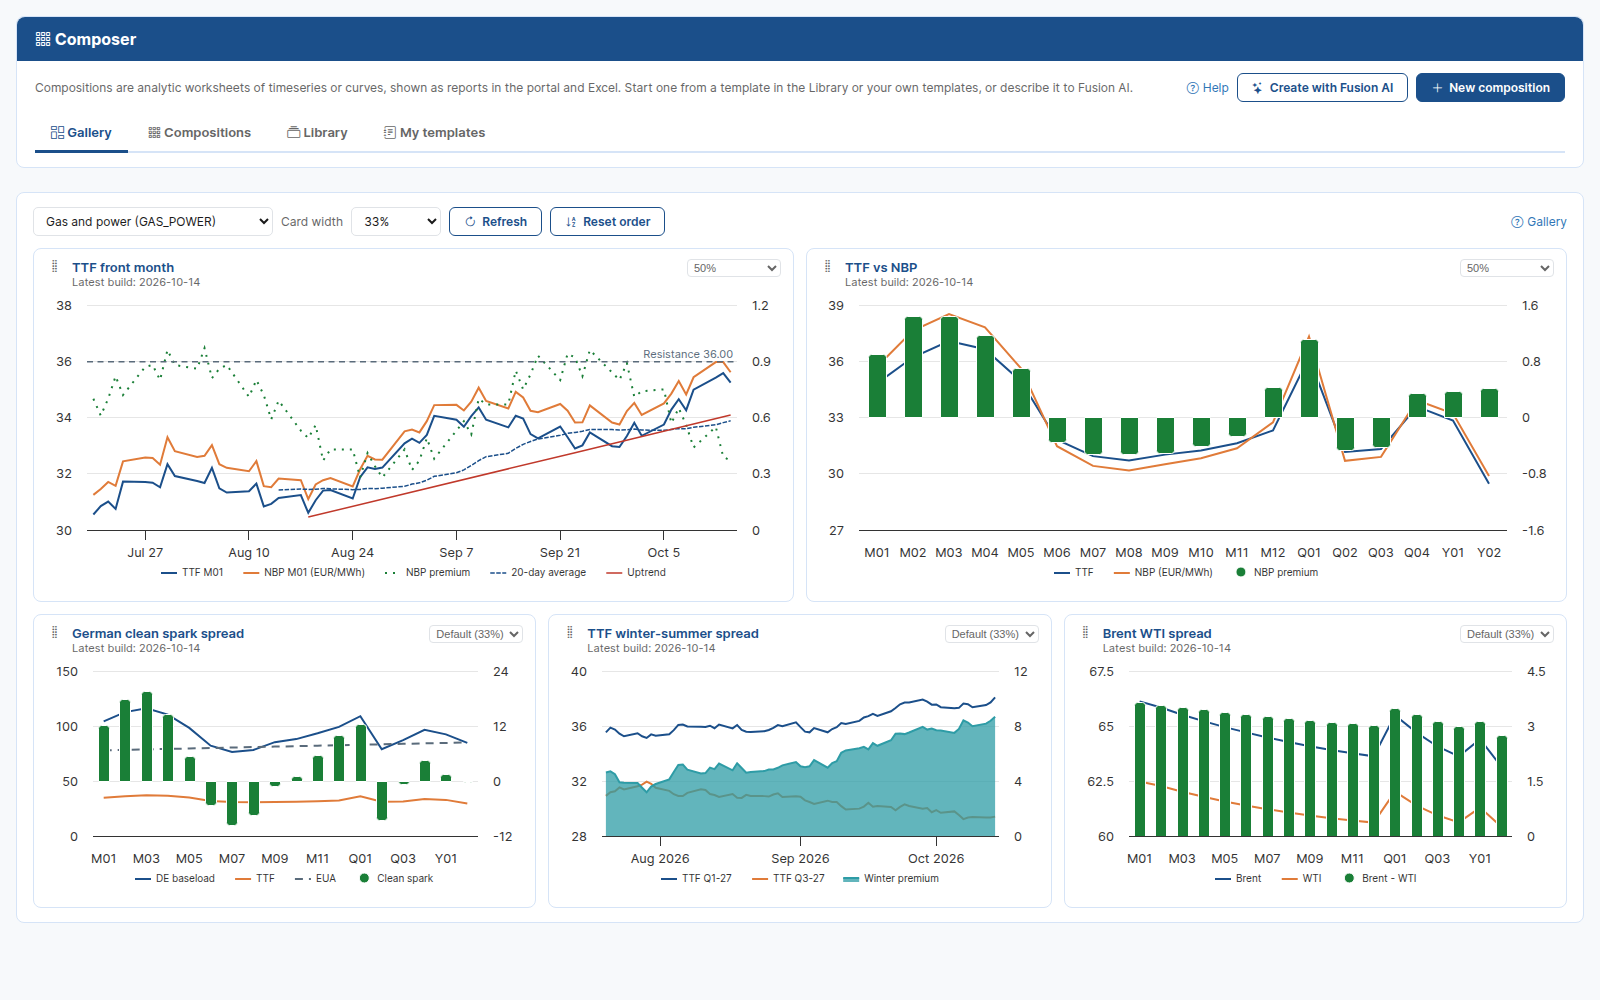
Each person arranges their own gallery: drag the cards into the order you want, and make the important ones wider. Composer remembers the layout for you, on any computer you sign in on. Click a card to open the composition in full.
Start from a template, or just describe it
Composer comes with a library of 50 templates across curves, power, gas, oil, carbon, coal, FX, metals, agriculture, risk and pricing, including:
- Curve spread and timeseries spread
- Clean spark spread, clean dark spread and market implied heat rate
- 3:2:1 crack spread and product crack spread
- Gas hub basis and oil-indexed gas price
- Rolling front months and spot against front month
- Hedge mark to market and indexed contract price
- US LNG export margin, seasonal storage spread and oil to gas price ratio
- Tolling margin, PPA value and contract for difference payment
- FX cross rate, ECB major currencies rebased to 100 and gold to silver ratio
- Coal arbitrage API2 against API4 and soybean crush spread
A template asks only for its inputs, such as the curves to use, and creates a composition you can then change as you like. Save any composition as a template of your own, so the whole team can reuse the design with their own curves.
Or skip the template altogether. Describe what you want to Fusion AI, such as "TTF against NBP in euros per MWh with the spread, for the next 12 months and 4 quarters", and Fusion designs the composition, finding the right curves on the platform. Ask it to change an existing composition and you see exactly what would change before you apply it.
Getting started
Composer is available now as an extension for OpenDataDSL customers. Open Composer from the Extensions menu, pick a template from the Library, and you will have your first composition in a few minutes.
The documentation covers everything in detail:
- What is Composer?
- Getting started
- The workspace
- Builds, composed curves and automation
- The template library
Your team's market views, built once and always current.
OpenDataDSL - Go Beyond the Basics.
Next steps
Do you want to see your own spreads and margins in Composer?
Tell us which views your team builds every day, and we will build one with you on your own curves.
- Contact us at info@opendatadsl.com
- Sign Up today and become part of the OpenDataDSL community!
- Fill out the form below, we will contact you to arrange a personally tailored demo.

How about a demo?
Our team is here to find the right solution for you, contact us to see this in action.
Fill out your details below and somebody will be in contact with you very shortly.